
Data-Driven Framework to Measure Lead Gen Success
Struggling with tracking your marketing ROI? You’re not alone. Only 21% of B2B marketers successfully track their return on investment, revealing a major gap in how businesses measure lead gen success. While most companies focus on generating leads, nearly 70% still fail to align sales and marketing teams effectively.
The truth is, it’s not just about getting more leads, it’s about measuring success the right way. Traditional lead generation metrics show visitor-to-lead conversion rates hovering between 2–5%, but optimized strategies can push those rates to 30–50%. That’s the difference a data-driven approach can make.
As someone who works deeply with data-driven marketing, I’ll show you how to measure lead gen success using the right KPIs at each funnel stage, from initial lead capture to final conversion. You’ll also get practical tips on tracking and optimizing these metrics for measurable growth.
Ready to refine your strategy? Let’s dive into the formulas, tools, and benchmarks that turn lead gen success from guesswork into a repeatable process.
Top-of-Funnel Metrics: Measuring Initial Lead Generation
Want to know if your marketing campaigns are working? Start at the beginning.
Measuring what happens at the top of your funnel gives you crucial insights about campaign effectiveness. These first touchpoints with potential customers tell you exactly how well your initial marketing efforts are performing.
Total verified leads across all channels
I always tell clients that the foundation of any good lead generation measurement starts here – tracking the total number of verified leads your business gets across all marketing channels.
What’s a verified lead? It’s a potential customer who’s provided real contact information and shown genuine interest in what you’re selling. This number gives you the big picture of how your lead generation is performing across different platforms.
But don’t just look at the total. Segment those leads by source to see which channels are your heavy hitters. According to recent studies, 95% of marketers say they know which channels drive the most leads to their business. With this breakdown, you can focus your marketing budget where it’ll make the biggest impact.
Visitor-to-lead conversion rate calculation
Now let’s talk about your visitor-to-lead conversion rate. This shows what percentage of your website visitors actually become leads – a direct reflection of how well your site generates interest.
The formula is simple:
Visitor-to-Lead Conversion Rate = (Number of Leads ÷ Total Number of Site Visitors) × 100%
Let me give you an example: if your website got 2,000 visitors and generated 100 leads, your conversion rate would be 5%. This directly tells you how effective your marketing team is at creating content that actually motivates visitors to become potential clients.
Most websites see conversion rates between 2-5%, though this bounces around depending on industry. B2B companies usually have lower rates than B2C because of those longer sales cycles.
Cost per lead (CPL) by source
How much are you spending to get each new lead? This is what CPL tells you, and it’s essential for making smart budget decisions.
To calculate it:
Cost Per Lead = Marketing Campaign Spend ÷ Number of New Leads
For instance, if you dropped $10,000 on social media ads and generated 200 leads, your CPL would be $50.
This gets really interesting when you break it down by channel. Check this out: A company spent $4,500 on PPC ads that brought in 45 leads (CPL=$100) and $12,000 on SEO content that generated 400 leads (CPL=$30). Pretty clear which channel gives you more bang for your buck, right?
Here’s where most businesses mess up – they only count direct advertising costs when calculating CPL. For an accurate picture, you need to include everything: personnel costs, campaign management, content creation, the works. This gives you the true story of how efficiently you’re acquiring leads across different sources.
Middle-of-Funnel Metrics: Evaluating Lead Engagement and Quality
Image Source: Mixology Digital
You’ve got leads coming in – great! But now comes the tricky part.
Once leads enter your funnel, figuring out which ones are worth your time becomes crucial for sales efficiency. Middle-funnel metrics show you exactly which prospects deserve more attention and which ones might just waste your team’s valuable time.
Lead scoring using BANT or custom models
I couldn’t talk about lead quality without mentioning the BANT framework. It helps sales teams systematically assess leads through four essential criteria: Budget, Authority, Need, and Timing. Over 52% of salespeople find this approach reliable for qualification. Not surprising, since it helps you zero in on prospects most likely to convert.
Here’s how I implement BANT with my clients:
First, establish your buyer persona, get super clear about who your ideal customer is. Then create specific qualifying questions for each criterion:
- Budget: Do they have the money to pay for your solution?
- Authority: Are you talking to the person who can say “yes”?
- Need: Does your solution actually solve their pain points?
- Timing: When are they planning to make a decision?
Some companies kick this up a notch by adding Solution Fitment (making it BANTS), which gives an even more complete picture. Whatever approach you take, good lead scoring helps you focus on high-potential prospects, saving your sales team tons of time and boosting overall efficiency.
Marketing Qualified Leads (MQL) to Sales Qualified Leads (SQL) ratio
One of my favorite metrics is the MQL to SQL conversion rate. It shows how many marketing-identified prospects actually turn into genuine sales opportunities – and it tells you a lot about how well your marketing and sales teams are working together.
The calculation is straightforward:
MQL to SQL Conversion Rate = (Number of SQLs ÷ Number of MQLs) × 100%
Industry benchmarks put a healthy average between 10-20%, though Salesforce data shows the typical rate is around 13%. If you’re consistently falling below 10%, something’s probably off with your lead qualification processes or your marketing and sales teams aren’t on the same page.
What I love about this metric is that it shines a light on both marketing effectiveness and sales follow-up quality. It’s like a health check for your entire funnel.
Email open and click-through rates
Email engagement metrics tell you a ton about mid-funnel lead quality and interest levels. Open rates show who’s viewing your messages, while click-through rates (CTR) reveal who’s actually taking action.
Average email open rates typically sit between 15-25%, though they’ve jumped recently thanks to Apple’s Mail Privacy Policy. For click-through rates, you’re usually looking at averages around 2.5%, with B2B rates varying by industry.
I also pay close attention to the click-to-open rate (CTOR):
CTOR = (Total Unique Clicks ÷ Total Unique Opens) × 100%
This specifically measures how effective your content is, rather than overall campaign performance. Healthy rates generally fall between 20-30%. Plus, tracking which links get the most clicks reveals what your prospects are actually interested in, giving your sales team powerful conversation starters.
These mid-funnel metrics are the bridge between your initial lead gen efforts and your final conversion results. Get these right, and you’ll dramatically improve your overall marketing-sales effectiveness.
Bottom-of-Funnel Metrics: Tracking Sales Conversion
This is where the rubber meets the road – the moment of truth when prospects finally become paying customers. Measuring performance at this stage tells you exactly how well your entire lead generation strategy turns interest into actual revenue.
Lead-to-customer conversion rate formula
Here’s the metric that keeps CEOs up at night – the lead-to-customer conversion rate. It measures what percentage of your qualified leads actually become customers, giving you a direct window into your sales team’s effectiveness.
The formula couldn’t be simpler:
Lead-to-Customer Conversion Rate = (Number of Customers ÷ Total Number of Leads) × 100%
Let me give you a real example: if your business generated 50 qualified leads and 10 became customers, your conversion rate would be 20%. How does that stack up? Well, B2B companies typically average around 6%. So higher rates clearly signal more effective sales processes – with top performers consistently beating these industry averages.
Customer acquisition cost (CAC) breakdown
You’ve probably heard about CAC – your total investment to acquire each new customer. It’s essentially how much you spend before seeing a single dollar in return. And trust me, this number directly impacts whether you’re building a sustainable business or just burning cash.
The basic calculation looks like this:
CAC = Marketing and Sales Expenses ÷ Number of New Customers Acquired
But for a more accurate picture, I recommend this comprehensive formula:
CAC = (Marketing Costs + Wages + Software + Professional Services + Overhead) ÷ New Customers
What’s healthy? Your CAC should be significantly lower than your customer lifetime value (LTV), ideally with an LTV:CAC ratio of 3:1 or 4:1. The best rule of thumb I’ve found is spending 33% or less of your customer’s lifetime value on acquisition. Anything more starts eating into your profitability.
Sales cycle length by lead source
How long does it take from first contact to closed deal? This timeline fundamentally affects everything from revenue forecasting to cash flow. Tracking it helps you spot bottlenecks and find opportunities to speed things up.
The calculation is straightforward:
Sales Cycle Length = Total Days to Close All Deals ÷ Number of Closed Deals
The average SaaS sales cycle runs about 84 days, but your numbers will likely vary by lead source. That’s why breaking this down by channel is so valuable – it shows you which sources not only bring in leads but bring in leads that close quickly. Shorter sales cycles usually mean more efficient processes and better-qualified leads coming in the door.
What impacts cycle length? Several factors come into play, including lead quality, sales process efficiency, and deal complexity. To improve this critical metric, make sure you’re qualifying leads properly, approaching customers through their preferred channels, and giving your sales team the right content to handle common objections.
Materials and Methods: Tools for Tracking Lead Generation KPIs
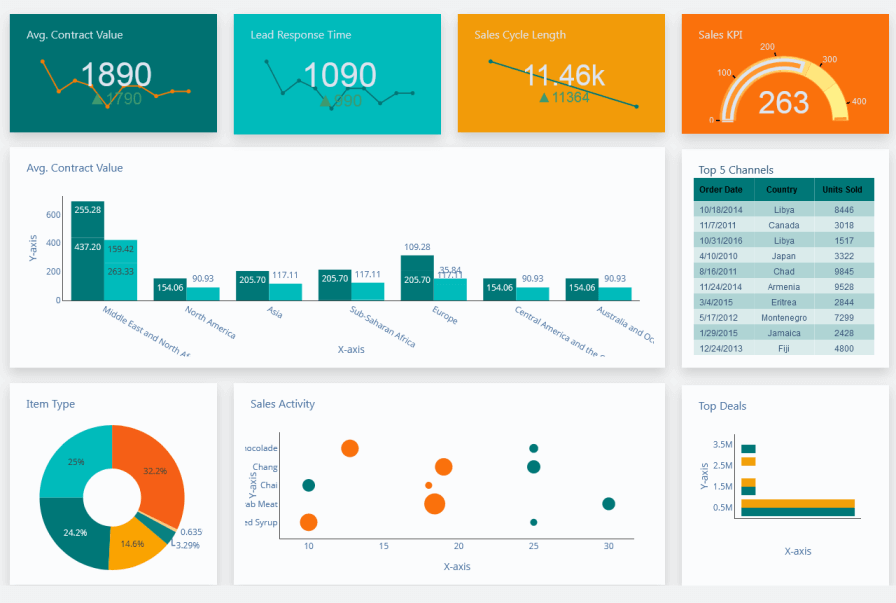
Image Source: Dashboard Builder
Let’s talk about the tech you need to actually track all these metrics. You can’t measure what you can’t track, right?
Successful lead tracking needs the right technological setup to measure, analyze, and optimize your efforts. I’ve found three essential tool categories that form the backbone of any data-driven lead generation framework.
CRM platforms for lead tracking and scoring
Your CRM system is command central for managing lead interactions and evaluating quality. I’ve seen HubSpot’s lead scoring feature work wonders for many businesses – it helps prioritize and qualify leads by combining fit and engagement data points. What’s great about this approach is it looks at both how well prospects match your ideal customer profile and how interested they actually are in your products.
When you’re shopping for a lead scoring platform, keep an eye out for:
- AI-assisted scoring capabilities that analyze past successful conversions
- Transparent scoring systems where all team members can access lead scores
- Customization options that align with your specific business needs
Other solid platforms include Salesforce’s Sales Cloud, which bundles lead scoring as part of its comprehensive CRM solution, and Freshsales, with its context-driven sales automation.
Web analytics tools for behavioral insights
Want to know what visitors are actually doing on your site? That’s where web analytics tools come in handy. They show you crucial information about visitor behavior, helping you understand which content drives real engagement. Google Analytics dominates this space with over 80% market share, giving you insights into sales conversions, product performance, and revenue data.
These tools track all kinds of useful metrics – pageviews, unique visits, and engagement indicators through cookies and tracking codes embedded in your web pages. I’m also a big fan of behavioral analysis tools like heatmaps that visualize where users click and focus their attention, highlighting exactly which areas get the most engagement.
Attribution modeling using UTM parameters
Ever wonder which marketing channel actually deserves credit for a conversion? Attribution connects leads to their interactions across various channels, identifying which touchpoints actually drive conversions. UTM parameters are those code snippets you add to URLs that enable precise tracking.
These parameters typically include utm_source (traffic source), utm_medium (marketing channel), utm_campaign (specific initiative), utm_content (specific ad), and utm_term (keywords). When people interact with your UTM-tagged links, analytics tools capture this data, showing you exactly which marketing activities are getting results.
Last-click attribution, the most common model in Google Analytics, gives all the credit to the most recent source before conversion. But more sophisticated models like first-click, linear, or weighted attribution distribute credit differently across multiple touchpoints. This matters because the customer journey is rarely a straight line!
Results and Discussion: Interpreting Lead Generation Metrics
Image Source: LeadFuze
So you’ve got all these numbers – now what?
Analyzing lead generation data transforms those raw numbers into insights you can actually use. I’ve found that when you interpret these metrics correctly, you can make smart decisions about where to put your marketing dollars and how to allocate your team’s time.
How to calculate lead conversion rate across funnel stages
Want to know how effectively prospects move through your sales pipeline? That’s exactly what lead conversion rates show you. The formula is super straightforward:
Conversion Rate = (Number of Conversions ÷ Number of Leads) × 100%
But here’s where most marketers mess up – they only look at overall conversion. Instead, apply this formula to each stage of your funnel:
- Top-of-funnel: Visitor-to-lead conversion (typically 2-5% across industries)
- Middle-of-funnel: MQL-to-SQL conversion (healthy rates average 13-26%)
- Bottom-of-funnel: Lead-to-customer conversion (B2B averages around 6%)
This stage-by-stage approach pinpoints exactly where prospects are dropping off. That way, you can focus your improvement efforts on the leaky parts of your funnel instead of treating conversion as one big number.
Identifying high-performing lead sources
Not all lead sources are created equal. From my experience, understanding which channels deliver your best leads means analyzing three key factors:
First, look at consistency – your best lead sources stay reliable even when markets fluctuate and keep performing over the long haul. Next, check cost efficiency by calculating Cost Per Lead for each channel and comparing it against customer lifetime value to figure out true profitability. Finally, don’t forget about lead quality – track which sources bring in prospects that actually match your ideal customer profile and show real intent to buy.
When you analyze all three dimensions, you start seeing which channels truly drive business growth versus those just pumping in lots of low-quality leads. I’ve seen companies triple their ROI just by shifting budget from high-volume, low-quality channels to more targeted ones.
Using benchmarks to evaluate performance
How do you know if your numbers are any good? That’s where benchmarking comes in. Industry averages vary wildly – e-commerce conversion rates bounce between 0.6-5.5%, while SaaS businesses typically hit around 7%.
But I don’t recommend obsessing over industry standards alone. Instead, track your own historical performance to create internal benchmarks. This approach lets you spot trends, account for seasonal changes, and measure real improvements over time.
And remember – conversion rates aren’t everything. A high conversion rate paired with sky-high acquisition costs still means you’re running an inefficient process. I always tell clients to watch lead quality indicators like MQL-to-SQL ratio alongside their cost metrics for the full picture.
Limitations of Lead Generation Metrics
Let’s be real for a second – even the fanciest lead generation frameworks have some blind spots. Understanding these limitations helps you avoid jumping to wrong conclusions when analyzing your data.
Attribution gaps in multi-touch journeys
Here’s the truth: tracking a prospect’s full journey across multiple touchpoints is one of the biggest headaches in lead generation measurement. I’ve seen dozens of companies struggle with this. Without solid attribution modeling, you just can’t tell which marketing efforts are actually driving conversions. This gets even messier when you’re pulling data from different sources and systems.
And don’t get me started on cross-device tracking! Customers jump between their phone, laptop, and tablet during the buying journey. Each switch creates blind spots in your attribution data, and suddenly you’re making budget decisions based on incomplete information.
What makes this worse is there’s no standard way to do attribution. With no universally accepted method, everyone tracks and measures leads differently, making it nearly impossible to compare results across campaigns or benchmark against competitors.
Over-reliance on quantitative data without feedback
Numbers are great, but quantitative lead generation metrics only tell half the story. They show what’s happening but rarely explain why.
Ever had a feature with great ratings but terrible engagement? Quantitative data alone leaves you scratching your head about what’s really going on.
I see this all the time with surveys too. Those closed-ended questions limit how people can respond, potentially missing the juicy details about their actual experience. This becomes a real problem when you’re making product decisions based solely on numbers.
Here’s another limitation – quantitative research is awesome at tracking what people do but terrible at explaining why they do it. Without adding qualitative insights for context, you risk building strategies on a shaky foundation of assumptions about what your prospects actually want.
Industry-specific variability in conversion benchmarks
Think a 3% conversion rate is bad? It might be fantastic depending on your industry!
Lead conversion rates swing wildly across different business types. What counts as “good” changes dramatically based on product complexity, sales cycle length, and target audience.
Something I’ve noticed consistently: industries selling high-value products and services typically see lower average conversion rates. This makes perfect sense – buyers get more cautious with big investments and often want to talk to a real person before making decisions.
Look at event-based lead conversion rates as an example – webinars typically convert at 10-20%, while workshops hit 30-50%. Or consider paid search – conversion rates average 2.7% across industries, but that’s actually a 125% jump from previous years.
This is why blindly comparing your metrics to general benchmarks can be misleading. Your 4% conversion rate might be crushing it in your specific industry, even if some marketing guru’s blog post says you should be hitting 10%.
How to Improve Lead Generation Based on Data
Image Source: FasterCapital
So you’ve got all this data – what now? This is where the rubber meets the road.
After collecting lead generation data, the magic happens when you actually do something with those insights. I’ve seen companies collect mountains of data and then let it sit there gathering digital dust. Don’t be that company! Let’s focus on three critical areas where applying your data strategically can transform your results.
Optimizing landing pages for higher conversion
Think of your landing pages as digital storefronts. When I first started optimizing landing pages, I made the classic mistake of cramming them with too much information. Now I know better.
To boost conversion rates, get straight to the point – communicate value immediately. Whether you’re offering a guide, templates, or webinar access, make it crystal clear what visitors will get and exactly what action they need to take.
Keep navigation minimal – too many options just confuse people. Place your CTAs strategically at the top, middle, and bottom of the page. Did you know personalized CTAs convert 202% better than generic ones? That’s not a typo – 202%!
Don’t forget the power of visuals. Adding compelling images or videos grabs attention fast. About 30% of top-performing landing pages feature video content. I’ve seen conversion rates double just by adding the right video to a landing page.
For your lead-gen forms, less friction means more conversions. Try multi-step designs instead of one giant form. Breaking a 15-field form into several steps with easier questions first significantly boosts completion rates. I also always include privacy policies to reassure visitors their data is safe (plus it’s required under regulations like GDPR anyway).
Segmenting leads for personalized nurturing
I can’t tell you how many businesses I see blasting the same generic message to their entire email list. It’s like shouting into a crowded room hoping the right person hears you.
Data-driven lead segmentation lets you create tailored nurturing strategies that address specific pain points. I divide leads into three primary categories:
- Demographic segmentation (age, gender, location)
- Behavioral segmentation (how they’ve interacted with your brand)
- Psychographic segmentation (interests, lifestyle, values)
The results speak for themselves. Segmented email campaigns show 14.31% higher open rates and 101% more clicks than non-segmented approaches. Beyond just email metrics, studies show segmentation improves sales by 89% while bumping up average order value by 59%.
A/B testing lead magnets and CTAs
You think you know what your audience wants, but do you really? A/B testing turns gut feelings into data-driven decisions.
Test different lead magnets to see what people actually prefer – discounts, checklists, infographics, or ebooks. Just remember to test one variable at a time for reliable results. I learned this the hard way after running a test with multiple changes and having no idea what actually worked!
For CTA optimization, play around with button colors, placement, size, and copy. Even small tweaks can yield huge improvements – sometimes by as much as 300%. I love testing countdown timers to create urgency, as they often push more visitors to convert.
One thing I always tell clients: A/B testing isn’t a one-and-done activity. It’s an ongoing process of making small, incremental improvements based on solid data. The companies that win at lead generation are the ones constantly testing and optimizing.
Conclusion
Let’s be honest – without data, lead generation is just expensive guesswork.
Throughout this guide, I’ve walked you through the essential metrics across your entire funnel – from those first visitor interactions all the way to final customer conversion. These measurements shine a light on exactly where prospects engage or drop off, so you can optimize each stage of your lead generation process.
From my experience working with dozens of companies, successful lead measurement boils down to three key elements: solid tracking infrastructure, regular analysis of both numbers and customer feedback, and continuous optimization based on what you learn. Don’t try to track everything at once. Start with basic funnel metrics, then gradually expand your measurement framework as you identify areas that need deeper analysis.
Here’s the thing though – metrics mean absolutely nothing without action. Focus first on tracking conversion rates between funnel stages, cost per lead by source, and overall lead quality scores. These fundamental measurements give you immediate insights to improve your lead generation strategy.
Did this guide on measuring lead gen success click for you? What’s one metric you’re going to focus on improving first? Let’s chat; GrowLeads.in is here to help.
Smart measurement drives smart decisions. I know tracking everything can feel overwhelming at first – I’ve been there too. But starting with just a few core metrics and expanding based on your specific needs creates a sustainable approach to lead generation optimization. Your data-driven journey starts with that first measurement – pick one metric and begin tracking today.
FAQs
Q1. What are the key metrics for measuring lead generation success?
The key metrics include visitor-to-lead conversion rate, cost per lead (CPL), lead-to-customer conversion rate, and customer acquisition cost (CAC). These metrics help evaluate the effectiveness of your lead generation efforts across different stages of the sales funnel.
Q2. How can I improve my lead conversion rates?
To improve lead conversion rates, focus on optimizing landing pages, personalizing your CTAs, segmenting leads for targeted nurturing, and conducting A/B tests on lead magnets and CTAs. These strategies can significantly boost engagement and conversions throughout your sales funnel.
Q3. What tools are essential for tracking lead generation KPIs?
Essential tools for tracking lead generation KPIs include CRM platforms for lead tracking and scoring, web analytics tools for behavioral insights, and attribution modeling using UTM parameters. These tools help gather and analyze data to measure the effectiveness of your lead generation efforts.
Q4. How do I calculate the lead-to-customer conversion rate?
To calculate the lead-to-customer conversion rate, use this formula: (Number of Customers ÷ Total Number of Leads) × 100%. This metric reveals how effectively your sales team converts qualified leads into paying customers.
Q5. What are some limitations of lead generation metrics?
Some limitations of lead generation metrics include attribution gaps in multi-touch customer journeys, over-reliance on quantitative data without qualitative feedback, and industry-specific variability in conversion benchmarks. Understanding these limitations helps in interpreting data more accurately and making informed decisions.

Builds the demand intelligence, automation, and deliverability systems behind Growleads pipeline.