
Signal-Based Outbound: The Complete B2B Guide [2026]
What is signal-based outbound?
Signal-based outbound is the practice of identifying behavioral and contextual signals that predict buying readiness, then sequencing outreach to land when a specific account is in an active evaluation window. It replaces volume-based cold outreach (send to everyone who matches the firmographic profile) with precision-based outreach (send to accounts that have demonstrated readiness through observable signals).
A signal is any measurable event that indicates a change in an account’s buying context. A new VP Revenue hired at a target company is a signal. An account spiking on “demand generation agency” keywords on Bombora is a signal. A company dropping a competing tech stack tool is a signal. A CFO posting on LinkedIn about pipeline predictability is a signal. Each event, on its own, is weak. Combined into a scoring system against a validated ICP definition, they become a reliable predictor of which accounts are worth reaching out to this week.
Signal-based outbound is not a tool category. It is a methodology. The tools (intent data platforms, data enrichment providers, sequencing platforms) are the equipment. The four-phase framework is the discipline that turns equipment into pipeline.
For the full demand intelligence context that sits above this methodology, see the Demand Intelligence category guide and the five-pillar framework. Signal-based outbound is the operationalized form of Pillar 1 (Signal Intelligence) in that framework.
Signal-based vs volume-based outbound
Volume-based outbound starts with a list. Build a list of everyone who matches the ICP criteria. Send them all the same sequence. Optimize the sequence to improve reply rate. Add more contacts when the list gets stale. Scale what works by sending to more people.
The math looks acceptable until you run it honestly. Woodpecker’s 2025 State of Cold Email analysis puts average B2B cold outreach reply rates at 0.5-2%. Broad sequences to purchased or scraped lists average under 1%. To book 10 qualified meetings from volume-based outbound, a team sends 1,000 to 2,000 emails. At a loaded SDR cost of $70/hour and 5 minutes of prep per email, that’s $5,800-$11,600 in SDR time before a single meeting is booked, not counting tool costs or management overhead.
Signal-based outbound starts with readiness, not a list. Only 3-5% of any total addressable market is in an active buying cycle at any moment (Forrester B2B Buying Dynamics Report, 2024). Signal-based outbound is the discipline of identifying that 3-5% before your competitors do, then reaching those accounts through the right channel at the right time.
The difference is not just reply rate. It is the quality of the meeting. An account that triggered a buying readiness signal before you reached out is more likely to show up, more likely to advance through discovery, and more likely to close within 90 days. Volume outreach books meetings with anyone who responds. Signal outreach books meetings with accounts that are actually moving.
Think of it like fishing. Volume-based outbound is a cast net dragged across the surface: it covers a wide area and catches whatever is present near the top. Signal-based outbound is sonar-guided: the signal shows you where the fish are feeding, at what depth, at what time of day. The sonar doesn’t replace the net. It tells the net exactly where to be.
The Growleads Signal-Based Outbound Framework
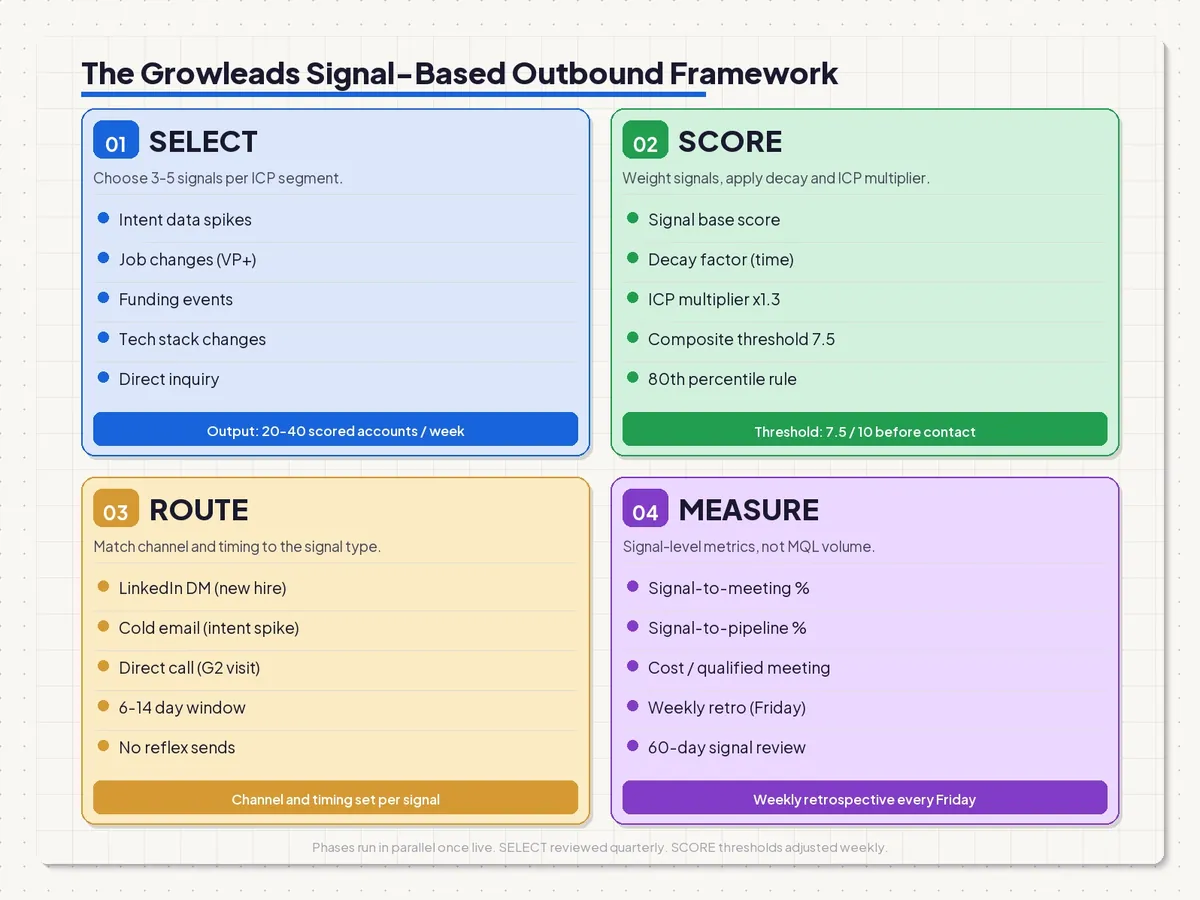
The Growleads Signal-Based Outbound Framework is a four-phase operating methodology for turning raw signals into qualified meetings. It was developed across 200+ B2B client campaigns between 2023 and 2026 across technology, professional services, healthcare IT, and supply chain verticals.
The four phases are:
- Select: choose which 3-5 signals to track per ICP segment, and why
- Score: weight those signals, apply ICP match and decay factors, set an outreach threshold
- Route: assign each threshold-crossing account to the right channel and right timing window
- Measure: track signal-to-meeting rate (not MQL volume), run the weekly retrospective, prune what is not working
The framework is not a waterfall. The four phases run in parallel once the system is live. Select is revisited every quarter. Score thresholds are adjusted every Friday. Route mappings evolve as channel data accumulates. Measure feeds back into Select. The system gets more precise over time because you are measuring it every week.
Why four phases and not six or ten
Most signal-based outbound guides collapse phases into lists of tactics. “Use intent data. Check job changes. Sequence in Outreach.” These are correct tactics. They are not a system.
The four-phase structure forces a decision gate between each phase. Phase 1 (Select) ends when you have committed to 3-5 specific signals. Phase 2 (Score) ends when accounts above the threshold have been identified and ranked. Phase 3 (Route) ends when each account has a channel, a sequence, and a send-date assigned. Phase 4 (Measure) ends when the retrospective has updated at least one parameter for next week.
If you skip a phase, the system does not fail catastrophically. It just runs at Phase 2 quality when you skip Phase 1 (too many signals, no pruning), or at Phase 3 quality when you skip Phase 2 (contacts same-day regardless of readiness, burns the window).
Phase 1: Select

Phase 1 is the most important phase because it determines the precision of everything that follows. A weak signal set produces noise at every subsequent phase. A well-pruned signal set produces qualified meetings by week six.
What qualifies as a signal
A signal is a measurable event at a target account that indicates a change in buying context. Not all events qualify. The event must meet three criteria:
- Observable. You can detect it from outside the account, either from a data provider or from public activity.
- Temporal. It happens at a specific time, which means there is a window to act on it.
- Predictive. There is historical evidence (your own data or published research) that this type of event precedes a purchase decision in your category.
Data that describes an account (industry, revenue, headcount) is firmographic. It is not a signal. A signal is a change: the account did something, hired someone, raised money, searched for something, dropped a tool, attended an event.
The 7 signal categories
| Category | Examples | Where to find it |
| Intent data | Topic surge on category keywords (Bombora), review page visits (G2), comparison page visits | Bombora, G2 Buyer Intent, ZoomInfo Intent |
| Job changes | New VP Revenue, new CRO, new Head of Demand Gen hired | LinkedIn, Apollo, ZoomInfo, Sales Navigator |
| Funding events | Series A/B/C, debt raise, PE acquisition | Crunchbase, LinkedIn announcements |
| Tech stack changes | Competitor tool dropped (e.g., left Salesloft, moved off HubSpot) | BuiltWith, Datanyze, Clearbit |
| Content engagement | LinkedIn post interaction, webinar attendance, content download | LinkedIn, CRM tracking, Clearbit |
| Community engagement | Posted in relevant Slack community, spoke at event, engaged on LinkedIn thread | Manual monitoring, Common Room, Orbit |
| Direct inquiry | Visited your pricing page, started a trial, filled out a contact form | First-party CRM data, Clearbit, Warmly |
Direct inquiry signals have the highest individual conversion rate. They are also the rarest. Don’t build a system that depends only on direct inquiry. You will run out of volume. The richest systems combine intent data (broad) with job change signals (narrow) with one first-party signal for warmth.
The 3-5 signal rule
When we built our first signal-based system in 2023, we tracked 40+ signals across 15 data sources. Six months in, we could not tell which signals actually predicted meetings. The dashboard looked sophisticated. The results were not. We spent six months pruning until we identified that 3-5 signals per ICP segment predicted 80% of our qualified meetings. The other 35+ signals were noise with a data subscription attached.
The rule: pick 3-5 signals per ICP segment. No more. Test them for one full quarter. Measure signal-to-meeting rate for each signal individually. Cut the ones below 3%. Add one new signal per quarter to test. The system compounds because you are measuring it, not because you are adding to it.
For a complete reference of 100 B2B buying signals organized by category and industry, see Buying Signals B2B: The Complete List.
How to choose your 3-5 signals
Start with your last 20 closed-won deals. Interview the sales reps or review the CRM notes. Ask: what changed at that account in the 60-90 days before we first reached out? What was different about the accounts that closed versus the ones we worked for 6 months and lost?
The answer is almost always the same: something changed. A new person joined. A budget was approved. A tool was dropped. A competitor entered their market. That change is the signal worth tracking.
If you have no historical data, start with the three highest-precision signal categories for any B2B category: new executive hire in a relevant function, intent data spike on category keywords, and a funding event. These three alone give you a signal-to-meeting conversion above 5% in most B2B verticals.
Common failure: the signal buffet
The signal buffet is what happens when a team activates every signal available from every tool in the stack. Bombora shows 80 accounts in topic surge. G2 shows 40 review visitors. Apollo shows 200 job changes. ZoomInfo shows 150 intent-flagged accounts. The total list is 400+ accounts, most of them wrong, with no clear priority.
The SDR team contacts the top 20 based on gut. The bottom 380 never get contacted. The system produces the same result as a filtered list, just with a more expensive dashboard in front of it.
The fix is Phase 2: a scoring system that collapses multiple signals into a single priority rank.
Phase 2: Score
Phase 2 takes the signals selected in Phase 1 and converts them into a composite score for each target account. The score determines which accounts cross the outreach threshold this week.
What signal scoring does (and does not do)
Scoring does not predict with certainty which accounts will close. It ranks which accounts are most likely to respond to outreach this week, based on the signal evidence you have. A score of 8/10 means “this account has shown multiple signals of buying readiness against your ICP definition.” It does not mean “this account has budget, authority, and timeline confirmed.”
What scoring prevents is treating all signaling accounts equally. Without scoring, a team sends to 400 accounts. With scoring, a team sends to the top 40 accounts this week, with the highest confidence of any week they could have chosen.
The scoring math: weighted signal × decay × ICP match
A simple scoring model has three components:
Signal weight: each signal is assigned a base score based on its historical signal-to-meeting conversion rate. A new VP Revenue hire might score 8/10 (high predictiveness). An intent data surge on a broad category keyword might score 5/10 (moderate predictiveness). A direct inquiry (pricing page visit) scores 10/10 (highest predictiveness, shortest window).
Decay factor: signals get weaker as time passes. A new VP Revenue hired 3 days ago is a fresh signal. The same hire 45 days ago means the person has already made initial vendor decisions. Apply a weekly decay of 10-20% depending on signal type: fast-decaying signals (G2 comparison visit) need immediate action; slow-decaying signals (funding round) hold relevance for 30-45 days.
ICP match multiplier: a perfect-fit account (exact industry, revenue band, tech stack, buyer persona match) gets a multiplier of 1.2-1.5 applied to the composite signal score. A partial-fit account gets 0.8-1.0. A borderline account should not reach the outreach threshold regardless of signal strength.
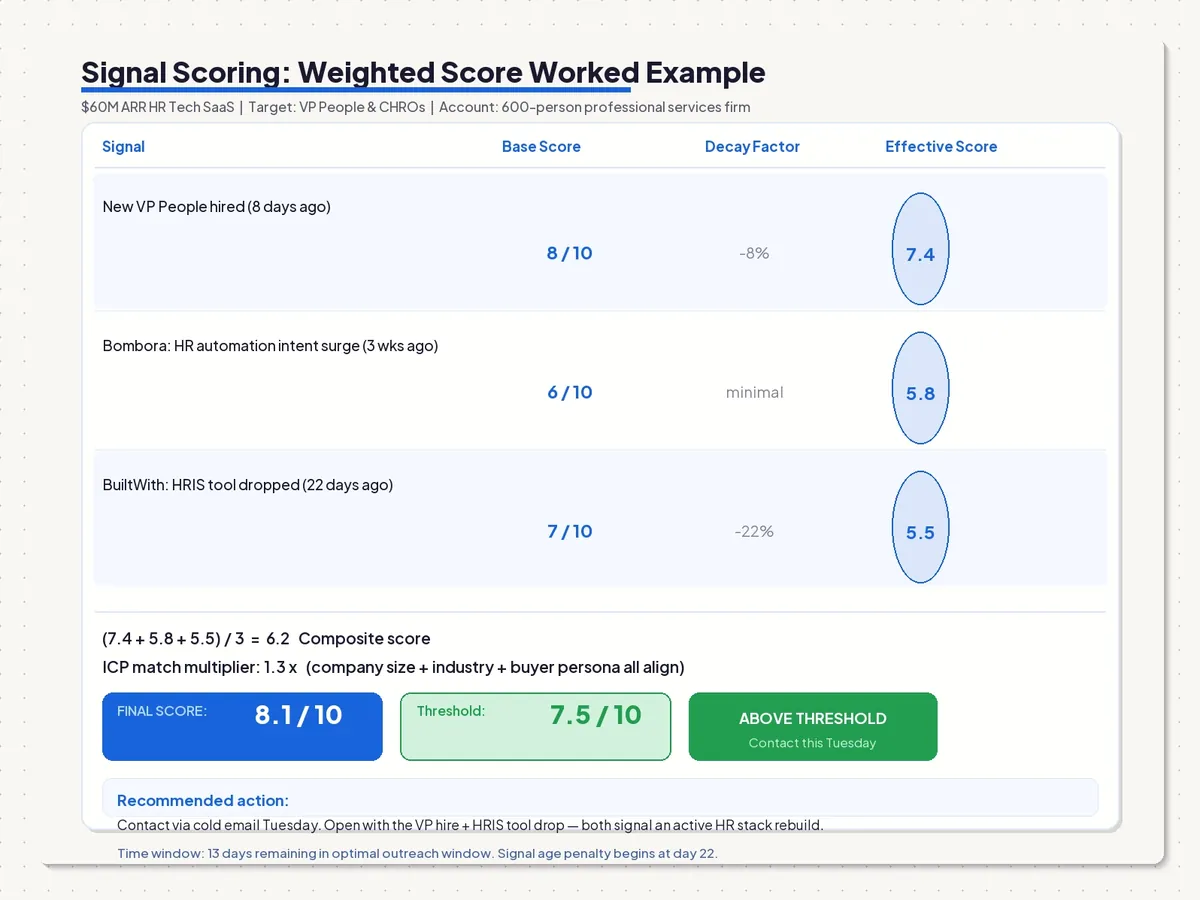
A worked example
Consider a $60M ARR HR tech SaaS targeting VP People and CHROs at companies with 200-2,000 employees.
Target account: a 600-person professional services firm.
Signal 1: New VP People hired 8 days ago (base score: 8/10, decay after 8 days: -8%, effective score: 7.4)
Signal 2: Bombora topic surge on “HR workflow automation” for the past 3 weeks (base score: 6/10, decay: minimal for sustained surge, effective score: 5.8)
Signal 3: BuiltWith shows they dropped their previous HRIS tool 22 days ago (base score: 7/10, decay after 22 days: -22%, effective score: 5.5)
Composite signal score: (7.4 + 5.8 + 5.5) / 3 = 6.2/10
ICP match: company size, industry, buyer persona all align; multiplier 1.3
Final score: 6.2 × 1.3 = 8.1/10
If the outreach threshold is 7.5/10, this account crosses on Tuesday’s send day. If the threshold is 8.5/10, it waits until Signal 2 or 3 strengthens or a fourth signal fires.
Threshold setting: when does a score mean “contact now”
Set the initial threshold at the 80th percentile of your signal-scored account universe. That means roughly 20% of the signaling accounts cross the threshold in any given week. This keeps the SDR or outbound team at a manageable volume (20-40 accounts per week for a solo IC, 60-100 for a small team) while maintaining precision.
Adjust the threshold quarterly based on capacity and conversion. If signal-to-meeting rate exceeds 8%, you can lower the threshold to include more accounts. If it drops below 3%, raise the threshold and tighten the signal selection.
Common failure: over-weighting one signal
Over-weighting a single signal collapses the scoring system into a single-signal trigger. If intent data carries 70% of the composite score, you are effectively running intent-triggered outreach with a math layer on top. The system works until the intent data provider has a bad quarter (data coverage gaps, index recalibrations), at which point the entire program stalls.
Distribute scoring weight across signal categories. No single signal should carry more than 40% of the composite score unless it is a direct inquiry (first-party signal), in which case it warrants its own fast-track queue.
Phase 3: Route
Phase 3 takes the threshold-crossing accounts from Phase 2 and assigns each one a channel, a sequence, and a send-date. This is where most teams skip ahead and launch the nearest available template. That is reflex outreach, not signal routing.
Why one channel is wrong
The instinct in B2B outbound is to pick a channel that works and route everything through it. A team finds that cold email gets 4% reply rates and starts routing all signal-triggered accounts into the cold email queue. Within two quarters, the reply rate flattens because the channel is no longer matched to the signal or the buyer persona.
Different signals indicate different buyer states, and different buyer states respond to different channels. An account that just hired a new VP Revenue is not yet ready for a cold email pitching a service they have never heard of. A direct message from a credible LinkedIn profile, referencing the transition, gets read first. An account that visited your G2 profile twice in 48 hours is in active vendor comparison mode. A direct email with a specific offer and a hard CTA lands now because the window is short.
Channel routing is not personalization. It is matching the activation channel to the buyer’s readiness state.
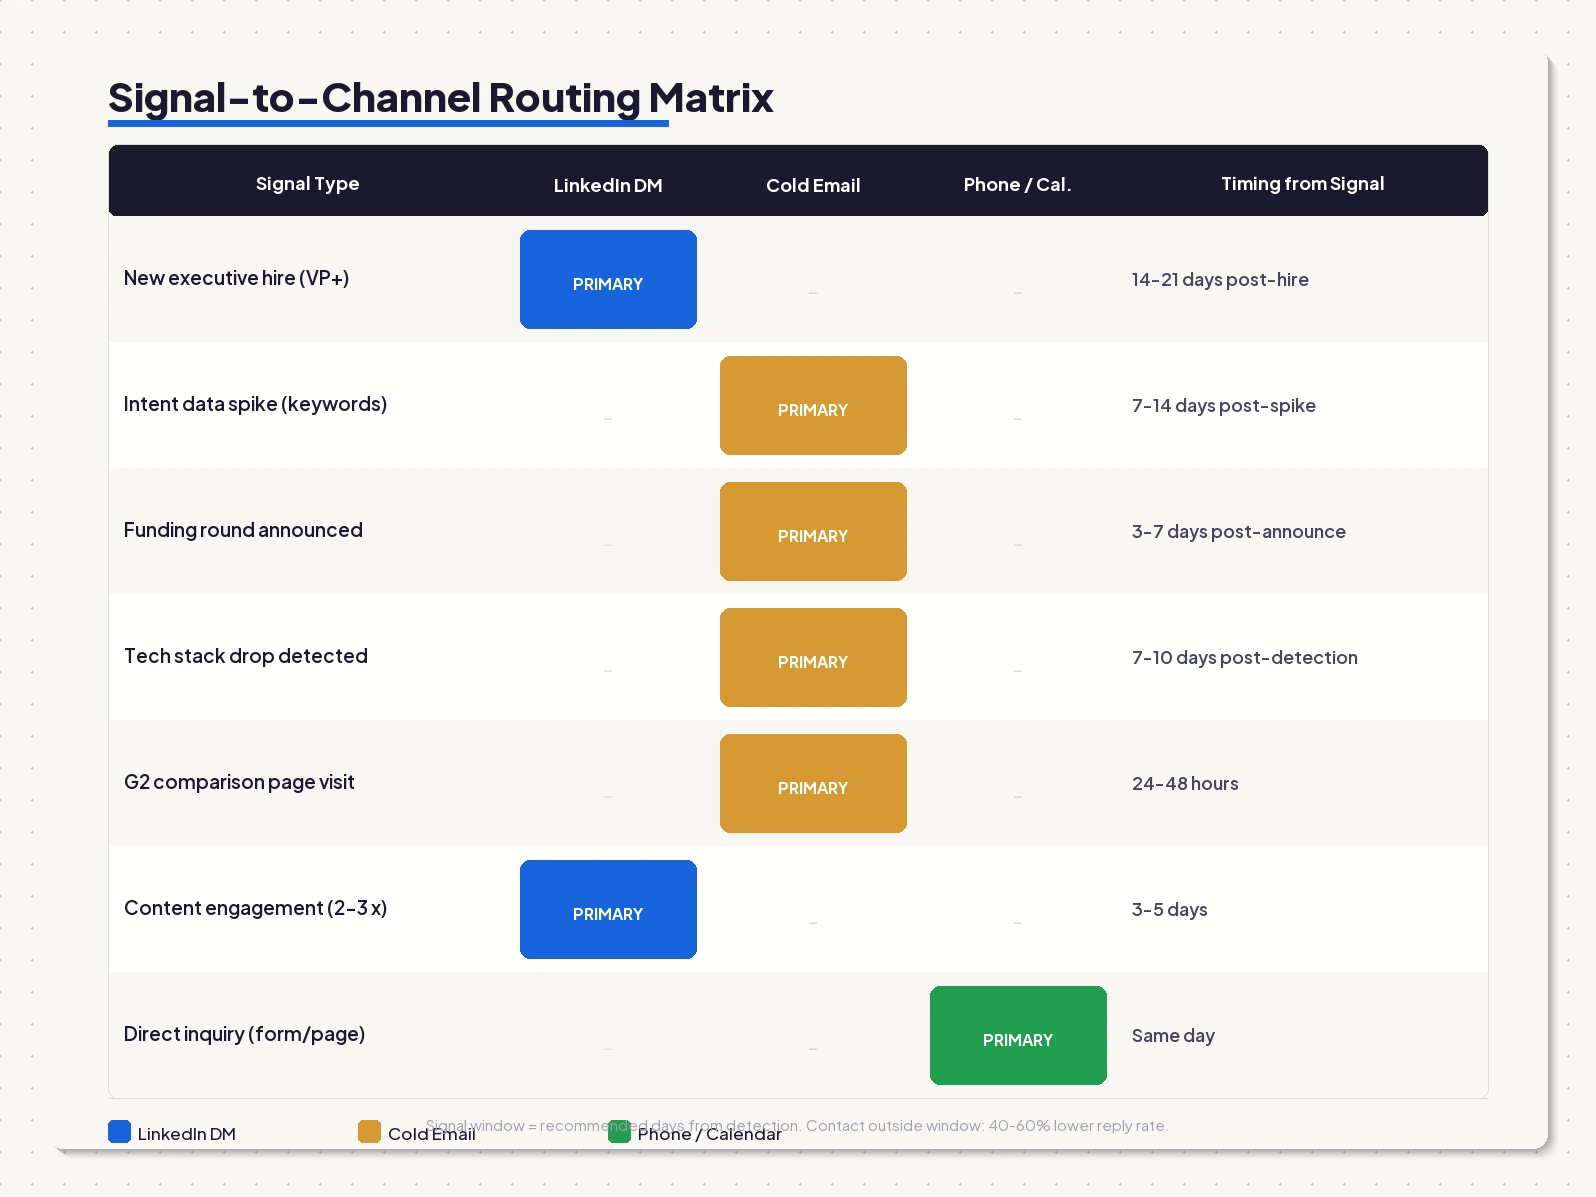
The signal-to-channel routing matrix
| Signal Type | Primary Channel | Timing from Signal | Why |
| New executive hire (VP+) | LinkedIn DM | 14-21 days post-hire | New leaders evaluate vendors in the first 60-90 days. Too early looks like surveillance. 14-21 days is orientation-complete. |
| Intent data spike (category keywords) | Cold email | 7-14 days post-spike | Buyer is in research mode, not evaluation mode. Let the research phase mature before outreach. |
| Funding round announced | Cold email | 3-7 days post-announcement | Budget decisions happen fast after a raise. |
| Tech stack drop (competitor tool exited) | Cold email | 7-10 days post-detection | The gap in the stack creates a procurement urgency. |
| G2 comparison page visit | Email (direct, immediate) | 24-48 hours | Short window. They are in active vendor evaluation. |
| Content engagement (LinkedIn 2-3 posts) | LinkedIn DM | 3-5 days | Engagement confirms awareness. DM continues the thread naturally. |
| Direct inquiry (pricing page, contact form) | Phone or calendar link | Same day | Highest-intent signal. Every hour of delay reduces conversion. |
For LinkedIn-channel outreach, the message opening should reference the specific signal context without stating it explicitly. “I saw your team recently expanded the revenue function” is better than “our intent data shows you searched for demand gen agencies.” One feels like a human observation. The other feels like a surveillance report.
For cold email sequences, Phase 3 also determines sequence length, touch spacing, and the specific message angle for each touch based on the signal type. A job-change signal warrants a transition-acknowledgment opening. A tech stack change warrants a capability-gap opening. These are different templates, not different personalization tokens on the same template.
Before reaching out on LinkedIn, ensure the sender’s profile is optimized. A buyer who receives a DM and then looks at a sparse or generic LinkedIn profile will not respond regardless of how good the signal is. The Growleads LinkedIn Profile Optimizer handles this for the outbound sender’s profile.
Timing after signal fires: the 6-14 day window
The timing window is the most counterintuitive part of signal-based outbound for teams coming from volume-based systems. Volume-based systems optimize for speed-to-lead. Signal fires. Sequence launches in three minutes. This feels efficient.
“Signal-based outbound is not a new tool category. It’s an old discipline that got a modern vocabulary. The best SDRs in 2015 were already doing it. They called it research. The difference in 2026 is that the signals are machine-readable, so the research scales. But the timing instinct still has to be human: you do not call someone three minutes after they read a brochure. You call them a week later when they have finished reading and started forming an opinion.” (Malay Gupta, Partner and Head of Operations and Growth, Growleads)
Most intent signals indicate that a buyer is in research mode, not evaluation mode. Reaching out in the research phase gets you flagged as “too early” and filtered as spam in the buyer’s mental inbox. Waiting 7-14 days means you arrive when the buyer has moved from “I should look into this” to “I need to find someone who does this well.” Being in the right place at the right moment is the entire game.
The exception is direct inquiry signals (pricing page, G2 profile visit, contact form). Those indicate the buyer is already in evaluation mode. The window is 24-48 hours.
Common failure: reflex outreach
Reflex outreach is what happens when signal detection is connected directly to sequence enrollment with no timing logic. The system detects an intent spike. The automation enrolls the account in the cold email sequence. The buyer receives an email three minutes after visiting a competitor’s G2 comparison page.
The buyer’s experience: “This company is tracking my every move.” That is not the first impression that opens conversations.
Build a deliberate delay into every signal-to-sequence trigger. For most intent signals, a 7-day delay improves meeting conversion. Test the delay window for your specific signals and measure the difference quarter over quarter.
Phase 4: Measure
Phase 4 is where signal-based outbound separates from intent-data-with-good-intentions. Phase 4 closes the loop. Without it, the system runs but does not improve. With it, the system compounds.
Why MQL is the wrong metric
MQL (marketing qualified lead) measures whether an account reached a lead score threshold defined by a marketing team’s assumptions about readiness. It measures the performance of the scoring system, not the performance of the outreach.
Signal-to-meeting rate measures whether the signals you selected and the outreach you deployed actually produced a meeting. It is a direct measure of system quality. If your signal-to-meeting rate drops from 6% to 3% over a quarter, the system is degrading. If it rises from 5% to 9%, the system is improving. MQL tells you neither.
The 3 metrics that matter
1. Signal-to-meeting rate: for every 100 accounts that crossed your scoring threshold, how many booked a meeting? Healthy benchmark: above 5%. Exceptional: above 10%. Below 3% means either the signal selection or the routing is wrong.
2. Signal-to-pipeline rate: of the accounts that booked meetings via signal-based routing, what percentage advanced to a qualified opportunity in the CRM? This measures the quality of the meetings, not just the quantity. A 6% signal-to-meeting rate with 20% pipeline advancement is better than 10% signal-to-meeting with 8% pipeline advancement.
3. Cost per qualified meeting: total spend on signal tools + SDR time allocated to signal-based outreach divided by qualified meetings booked from that outreach. Track this separately from your overall blended demand gen cost. It will show the ROI case for increasing the signal-based allocation relative to broad demand gen spending.
The weekly retrospective
Every Friday, run a 30-minute retrospective. Review four questions:
- Which signals produced the most threshold-crossing accounts this week?
- Of accounts that crossed the threshold, what was the signal-to-reply rate by signal type?
- Were there accounts that responded this week that we did NOT have in our signal queue? (Those are signals we missed. They should be added to Phase 1 testing.)
- Were there accounts in the signal queue that we contacted 3+ times with no response? (Those are either wrong signals or the timing was off. Note the failure, tag the account for 90-day re-evaluation.)
This retrospective takes 30 minutes. Over 12 weeks, it builds a signal performance log that becomes the most valuable document in your GTM stack: real evidence of which signals, in your market, in your ICP, in your product category, actually precede a meeting.
The 60-90 day learning cycle
Do not adjust signal weights or cut signals based on two weeks of data. Signal-based outbound has a lag: an account that crosses the threshold this week may not book a meeting for 21 days. Cutting a signal after 14 days of sub-threshold performance throws away half the data.
The minimum testing window for any signal is 60 days. Three signals × 60-day window = a quarterly review cycle. This is the right cadence for Phase 1 (Select) adjustments.
Common failure: measuring tactics instead of signals
Measuring open rates, click rates, and reply rates at the campaign level tells you how good your email copy and subject lines are. It does not tell you which signals predicted those replies. Measure at the signal level. Tag every outreach sequence with the signal that triggered it. Report signal-to-meeting rate by signal category, not by campaign.
The vendor-neutral tool stack
Signal-based outbound requires tools. The tools are the equipment. They are not the framework. A team that buys every tool in this list and skips the four-phase discipline will produce exactly the results they got before, at a higher monthly cost.
Signal source tools
| Tool | Signal category | Approximate cost (April 2026) |
| Bombora | Intent data (third-party topic surge) | Starting ~$3,000/mo; verify at bombora.com |
| G2 Buyer Intent | Review-stage signals (competitor comparison) | Varies by G2 plan tier |
| BuiltWith | Tech stack changes (tool install/drop detection) | $299/mo API; verify at builtwith.com |
| Clay | Data assembly, waterfall enrichment, signal routing | $149-$800+/mo |
| Apollo.io | Contact data + basic intent signals (entry-level) | $50-$150/seat/mo |
| ZoomInfo | Job changes, intent data, contact enrichment | $15,000-$30,000+/yr |
| LinkedIn Sales Navigator | Job change signals, organizational monitoring | $99-$199/seat/mo |
For most Growleads clients in the $50M-$200M ARR range, the minimum viable signal stack is Apollo (contact data + basic intent) plus G2 Buyer Intent (review-stage) plus LinkedIn Sales Navigator (job change monitoring). Total cost: $400-$600/seat/month. Bombora adds the broader intent layer for teams that need category-level demand signals outside their own product review ecosystem.
Routing and sequencing tools
| Tool | Best for | Approximate cost |
| Outreach.io | Enterprise teams, full sales engagement suite | $100-$150/seat/mo |
| Salesloft | Revenue workflow automation, CRM-integrated | $75-$125/seat/mo |
| Smartlead | High-volume email, deliverability-first teams | $39-$94/mo |
| Lemlist | Multi-channel sequences (email + LinkedIn + calls) | $59-$99/seat/mo |
| Apollo.io | Sequences built into the same contact data platform | See above |
Named tool opinion: for most signal-based outbound use cases, Lemlist is the best starting point for teams under 5 SDRs because it handles email and LinkedIn sequencing in one interface without requiring Outreach-level spend. Outreach is worth the cost when you need deep Salesforce integration and CRM-level reporting on sequence performance. Most teams at Stage 2 maturity are not at the Outreach use case yet.
Measurement tools
| Tool | What it measures | Notes |
| HubSpot CRM | Pipeline attribution, deal source tracking | Tag deals with signal source at creation |
| Salesforce | Enterprise-grade attribution, custom signal-source reporting | Requires RevOps setup for signal tagging |
| Gong | Call intelligence: what happens in meetings booked via signal | Useful for Phase 4 quality measurement |
| Clay | Signal scoring, account enrichment, trigger logging | Doubles as source and measurement layer |
The key measurement setup: create a custom field in your CRM for “signal source” (which signal type triggered the outreach) and “signal date” (when the signal was detected). Tag every deal that closes from a signal-triggered contact. After 6 months, you have an attribution model that tells you which signals, in your specific market, produce the highest-value pipeline.
Signal-based outbound reply rates: the real numbers
Vendors selling signal-based outbound tools and services sometimes claim 10x improvements over traditional cold outbound. This is misleading. They are averaging their best-performing client campaigns, often in categories with strong intent data coverage, over short measurement windows.
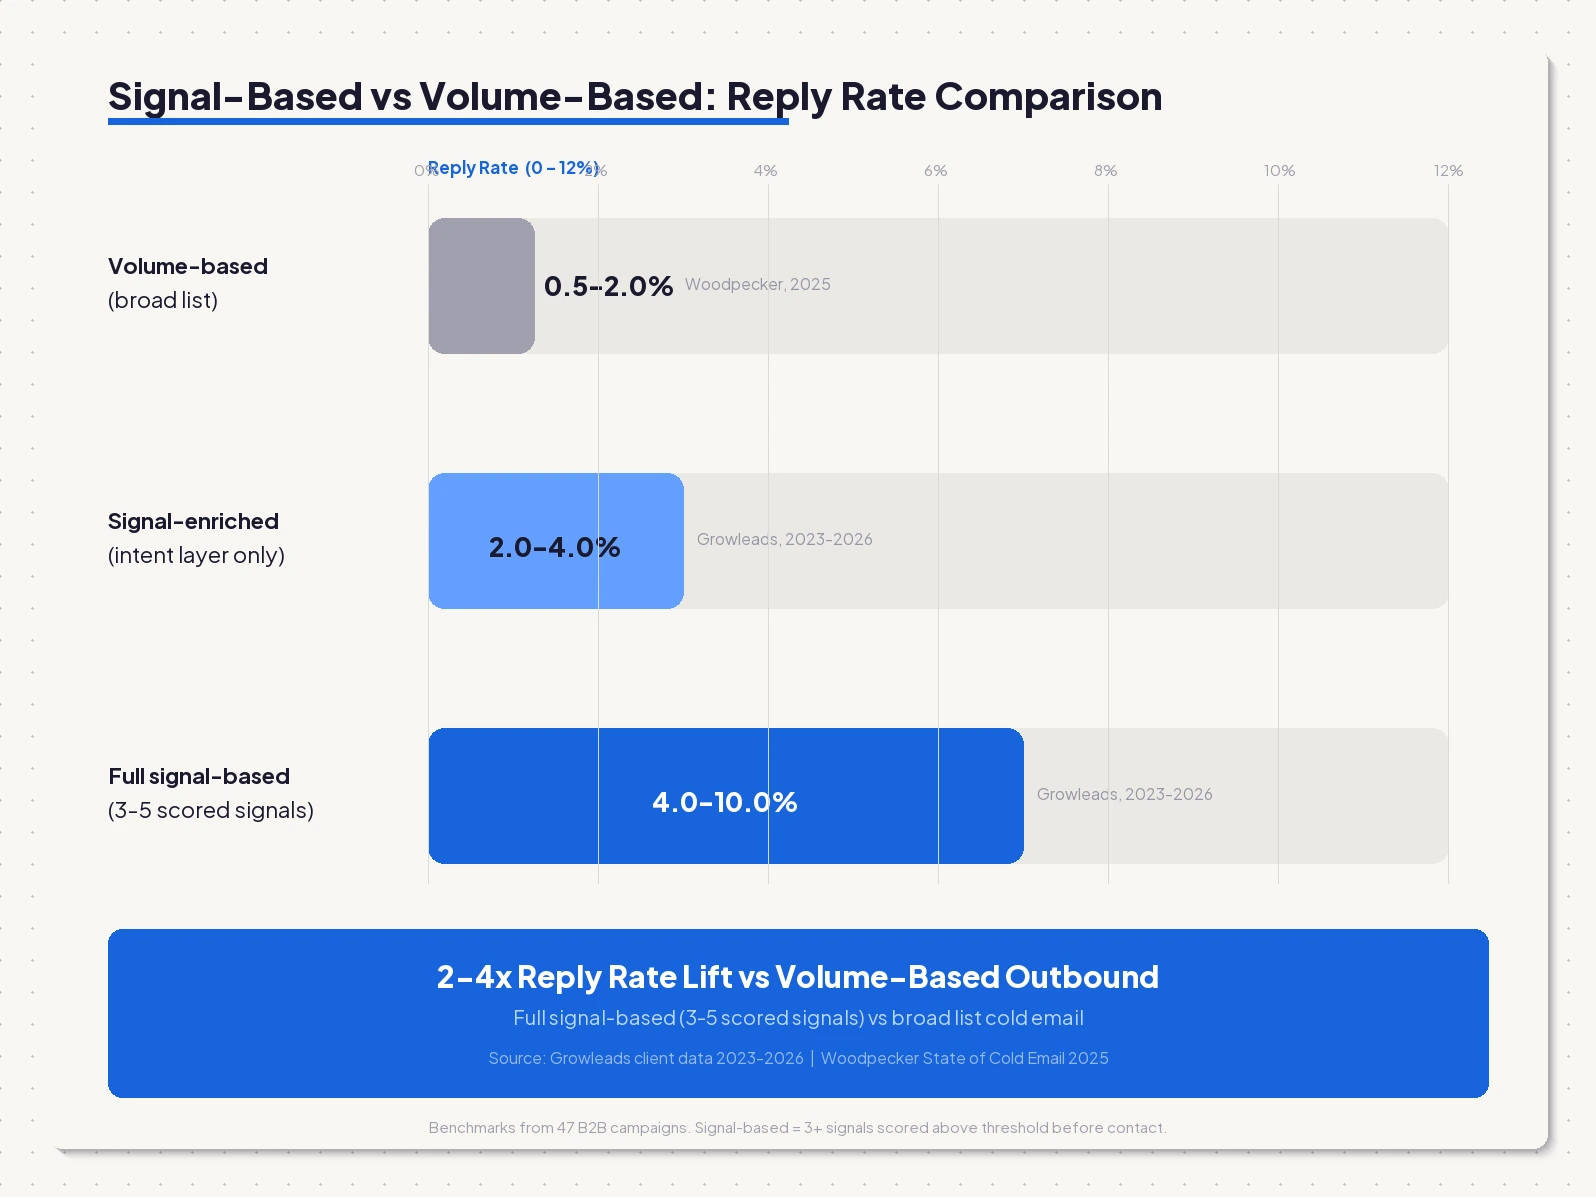
The real numbers from Growleads client campaigns from 2023 to 2026 across 200+ B2B engagements:
| Outbound type | Reply rate range | Qualified meeting rate | Cost per qualified meeting |
| Volume-based cold outbound (broad list) | 0.5-2% | 15-25% of replies | Benchmark |
| Signal-enriched (intent data layer only) | 2-4% | 25-35% of replies | 15-25% lower than benchmark |
| Full signal-based (3-5 signals, scored, routed) | 4-10% | 35-50% of replies | 30-40% lower than benchmark |
Woodpecker’s 2025 State of Cold Email analysis confirms the baseline: broad B2B cold outreach averages 0.5-2% reply rate. The 4-10% range for full signal-based outbound represents a 2-4x lift. That is the honest number. It is still a very good number. A 3x improvement on reply rate, combined with a 35-50% qualified meeting conversion rate versus 15-25% for volume outreach, means signal-based outbound produces roughly 4-6x more qualified pipeline per SDR hour.
That math justifies the tool investment and the operating discipline. It does not justify the 10x claims.
The weekly operating rhythm
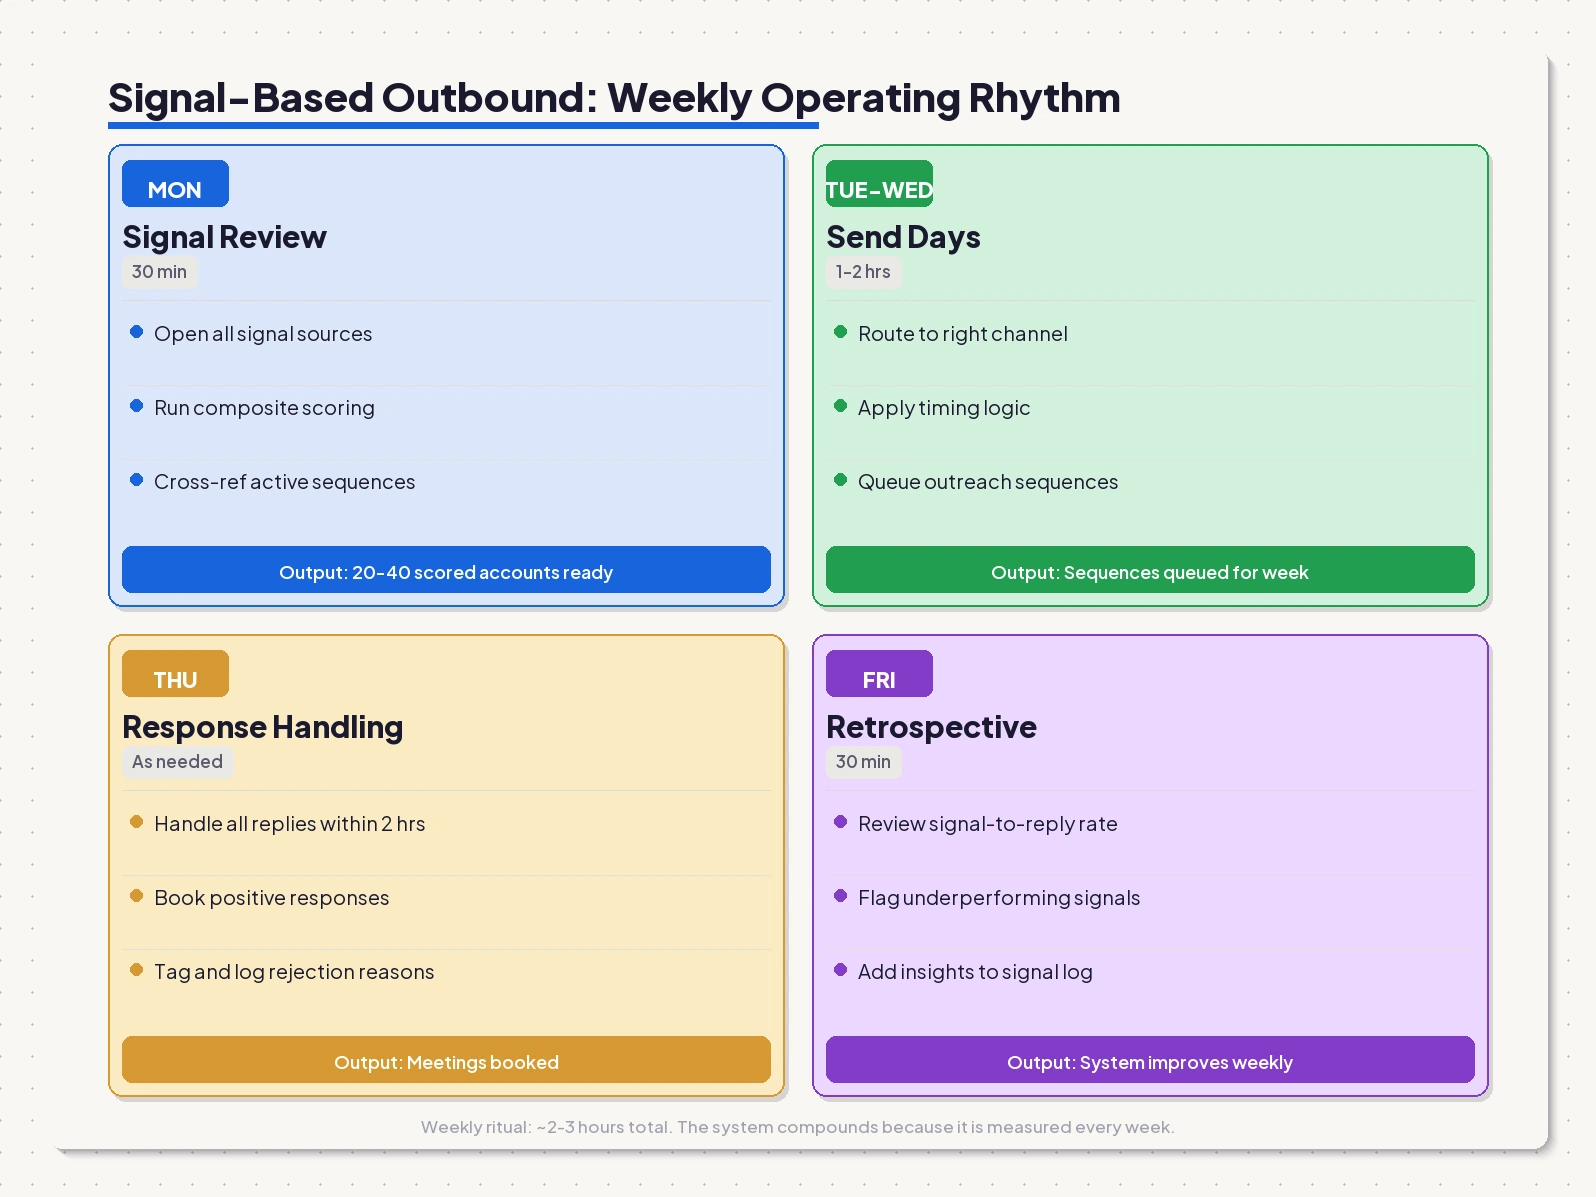
Signal-based outbound only compounds if the four phases are connected by a weekly operating ritual. The ritual is the difference between a Phase 2 system (intent data in a dashboard that nobody reads) and a Phase 3 system (signal output driving Monday’s account queue).
Monday: signal review and score refresh (30 minutes)
Open every signal source from the past 7 days. Pull which accounts triggered which signals. Run the composite scoring model. Identify accounts that crossed the outreach threshold. Cross-reference against current active sequences (do not double-contact). Identify net new accounts for the week.
Output: 20-40 prioritized accounts, scored, assigned to signal category, ready for Phase 3 routing.
Tuesday-Wednesday: send days
Assign each Monday account to the right channel and sequence based on the routing matrix. Verify send timing against the signal date (apply the 6-14 day delay logic). Enqueue sequences with correct start dates. Do not launch same-day unless the signal is a direct inquiry.
Output: 20-40 accounts queued with correct channel, sequence, and start date.
Thursday: response handling
Handle all replies from sequences currently active. Positive replies (interested, want to learn more, let’s talk) go directly to calendar booking. Do not let positive replies sit in the inbox for more than 2 hours. The same buyer who replied at 9am may book a competitor at 11am if you are slow.
Negative replies (“not the right time,” “already have a vendor”) get tagged with the reason and logged. Review those tags monthly. Patterns in rejection reasons often indicate a signal selection problem or a message angle problem, not a channel problem.
Friday: retrospective (30 minutes)
Review signal-to-reply rate for the week by signal category. Flag sequences below 2% reply rate for message review. Flag signals below 3% meeting conversion for signal quality review. Add one finding to the signal performance log.
This weekly cycle produces a self-correcting system. By month three, the signal selection, scoring thresholds, and routing logic are all calibrated to your specific ICP and market. By month six, the system runs faster and more precisely than it did at launch, without adding headcount.
Three failure modes to avoid
Failure Mode 1: The signal buffet
Activating every available signal and contacting every account that fires any signal at any threshold. The result: 300+ accounts per week, SDR overwhelm, signal quality invisible, reply rate indistinguishable from volume outbound.
The fix: commit to 3-5 signals per ICP segment before running Phase 2. Kill every other signal feed. Reintroduce one new signal per quarter, only after you have measured the current set.
Failure Mode 2: Reflex outreach
Signal fires at 9am. Sequence launches at 9:03am. The buyer, who is currently in research mode, receives an unsolicited email that proves you are watching their activity in real time. The meeting never happens.
A radiologist does not read every scan as it comes off the machine at 3am. The scan is queued for the morning review when the radiologist is rested, the full clinical context is available, and the referring physician’s question is clear. Signal-based outreach works the same way: queue the signal, apply the timing logic, reach out when the buyer is in the right state. Speed-to-lead is a volume-outbound metric. Signal-based outbound measures signal-to-meeting quality, not speed.
Failure Mode 3: Measuring campaigns instead of signals
Reporting email open rates and campaign reply rates without tagging which signal triggered each sequence. After 6 months, you know that “Campaign 3 Q2” performed better than “Campaign 1 Q1” but you have no idea whether it was the signal selection, the timing window, the message angle, or the channel that drove the difference.
Tag every outreach sequence at the signal level. Report in Phase 4 by signal category, not by campaign name. The signal performance log is the asset that compounds. Campaign reports are historical.
Getting started: what to do in Week 1
If your team has no existing signal infrastructure, do not buy six tools in the first week. Start with what you already have.
Day 1: Pull your last 20 closed-won deals from the CRM. Look at the account activity in the 60-90 days before first contact. What changed at each account? You are looking for patterns. Three deals where the trigger was “new VP hired 30 days prior” is a signal worth tracking.
Day 2: Set up LinkedIn Sales Navigator alerts for job changes at your top 100 target accounts. This is free with most Sales Navigator plans. It gives you a job-change signal layer without any new spend.
Day 3: Define your 3-5 signals based on the patterns from Day 1. Write a one-sentence description of each signal, what triggers it, where you will detect it, and how long the window lasts.
Day 4: Build a simple scoring spreadsheet. No scoring platform needed yet. Three columns: account name, signals fired this week, composite score (manual). Run it manually for four weeks before evaluating scoring tools.
Day 5: Pick two accounts from your manual scoring output and write signal-matched outreach to each. Not template-based. Signal-based. Reference what you observed. Test the channel the routing matrix recommends. Record the send date and signal date.
FAQ
What is signal-based outbound?
Signal-based outbound is the practice of identifying behavioral and contextual signals that predict buying readiness at a target account, then sequencing outreach to reach those accounts at the moment they are in an active evaluation window. It replaces volume-based cold outreach (contact everyone who matches the firmographic criteria) with precision-based outreach (contact accounts that have demonstrated readiness through observable, measurable signals).
How is signal-based outbound different from traditional cold outbound?
Traditional cold outbound selects accounts based on what they are (industry, size, title). Signal-based outbound selects accounts based on what they are doing right now. A new VP Revenue hire, an intent data spike on category keywords, a competitor tool being dropped from the tech stack: these are events that indicate a change in buying context. Signal-based outbound detects those events and times outreach to land during the window they create.
What signals should I track for B2B outbound?
Start with three signal categories that predict buying readiness in most B2B categories: new executive hire in a relevant function (VP Revenue, CRO, VP Marketing), intent data spike on category or competitor keywords, and a tech stack change (competitor tool dropped or installed). These three produce measurable signal-to-meeting conversion above 5% in most B2B verticals. For a reference list of 100 B2B buying signals organized by category, see the Buying Signals B2B Complete List.
What tools do I need for signal-based outbound?
The minimum viable stack: a job-change signal source (LinkedIn Sales Navigator, Apollo, or ZoomInfo), a sequencing tool (Outreach, Lemlist, or Smartlead), and a CRM with custom signal-source tagging. For a broader signal layer, add Bombora for intent data and G2 Buyer Intent for review-stage signals. Total entry-level cost: $400-$1,200/month. The most expensive element at any budget level is the person who reads the signals every Monday morning and makes the routing decisions.
Does signal-based outbound actually produce results?
Volume-based cold outbound averages 0.5-2% reply rates (Woodpecker, 2025). Full signal-based outbound (3-5 signals, scored, routed with timing logic) averages 4-10% reply rates in Growleads client campaigns from 2023 to 2026 across 200+ B2B client campaigns. That is a 2-4x improvement on reply rate and approximately 30-40% lower cost per qualified meeting. Vendors claiming 10x are averaging best-case scenarios. The real improvement is meaningful but not miraculous.
How long does it take to see results?
Expect the first signal-based meetings to appear in weeks 4-6 as you build the scoring model, validate signal selection, and allow the timing windows to mature. Meaningful reply-rate data takes 60-90 days per signal to accumulate. The system starts compounding at month 3 when the Phase 4 retrospective data informs signal pruning and Phase 1 reselection. Teams that evaluate signal-based outbound at week 4 and call it a failure almost always quit before the compounding begins.
Can you do signal-based outbound without intent data?
Yes. Intent data is one signal category, not the methodology. You can run a fully functional signal-based outbound system using only job-change signals (LinkedIn Sales Navigator), funding events (Crunchbase alerts), and tech stack change signals (BuiltWith). These three sources cost $300-$500/month combined and provide enough signal coverage for most B2B ICPs with under 2,000 target accounts. Add intent data when the target account universe expands or when category keyword monitoring adds precision above what job-change and tech-stack signals provide alone.
What is the difference between intent data and signal-based outbound?
Intent data is a signal source: it tells you which accounts are searching for topics related to your category. Signal-based outbound is a four-phase methodology: Select signals, Score accounts, Route to the right channel at the right time, Measure at the signal level. You can feed intent data into a signal-based system. You can also buy intent data and run volume-based outreach on top of it (which most teams do). The methodology is what turns intent data from an alert into a qualified meeting.
Want this run for you? The Growleads B2B lead generation agency service applies this framework end-to-end for B2B companies between $1M and $500M ARR. 1,200+ qualified meetings booked across 8 industries.

Builds the demand intelligence, automation, and deliverability systems behind Growleads pipeline.