
How to Measure AI Search Visibility Without Lying to Yourself
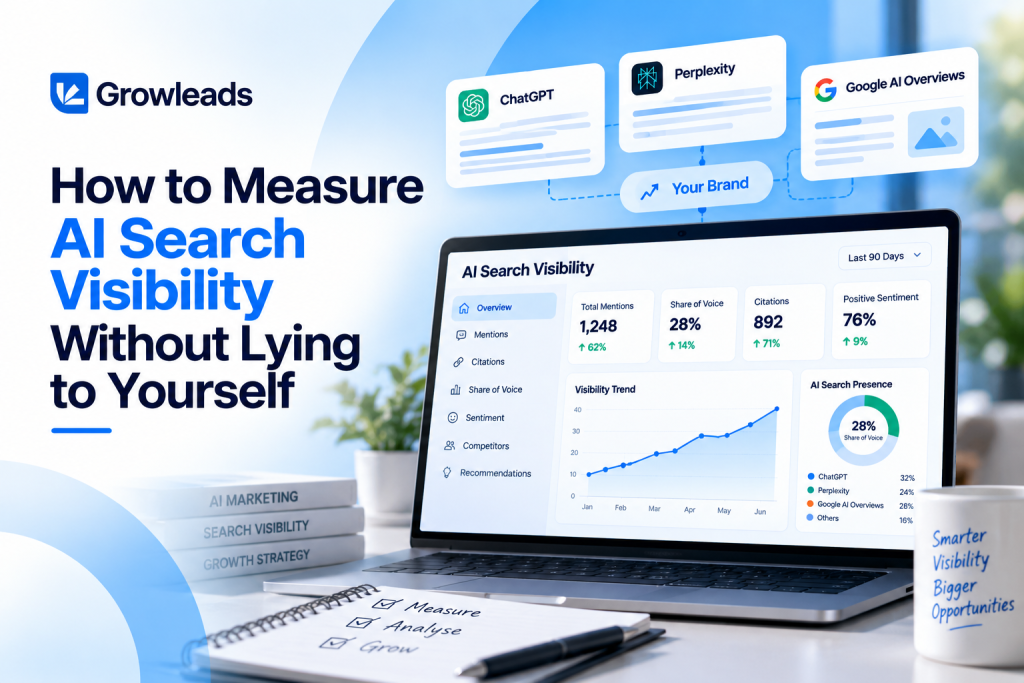
Measure AI search visibility by combining platform-reported exposure, repeatable tests of real buyer questions, brand and citation checks, and verified website and sales outcomes. Keep each signal separate, publish the denominator behind every percentage, and compare consistent samples over time. A mention shows that a brand appeared. It does not prove that a buyer noticed, trusted or purchased.
A visibility report can improve without the business becoming more visible to relevant buyers.
Add questions that already contain your company name, remove difficult prompts, or count every repeated link as a new win. The dashboard looks better. The evidence has not improved.
The useful question is not simply, “Did AI mention us?”
It is, “Where did we appear, under what conditions, how accurately, and what can we reasonably conclude from that?”
What AI search visibility actually measures
AI search visibility describes whether and how a brand or its content appears within AI-assisted answers and discovery experiences. Measuring that visibility requires separating brand presence, source citations, recommendations and actual audience exposure.
Those are related signals, but they are not interchangeable.
Your company can be mentioned without your website being cited. Your research can be cited without your company being recommended. A third-party article can recommend your service while your own website receives no visit.
Even the experience being measured matters. Google explains that AI Overviews and AI Mode can use different models and techniques, producing different responses and supporting links. A result from one should not stand in for the other. Google for Developers
A reliable report therefore distinguishes three questions:
- Brand presence: Did the answer identify the correct company or product?
- Source presence: Did the answer cite content from your website or another source discussing your business?
- Commercial relevance: Did the answer position your company as a suitable option for the buyer’s situation?
A screenshot can answer those questions for one response. It cannot establish how often the result occurs across buyers, locations or time.
Use an evidence ladder instead of one impressive score
Measure AI search visibility through separate levels of evidence. Do not allow a strong result at one level to stand in for a result you have not measured at another.
The following evidence ladder is an educational framework for organising a report, not a proprietary methodology.
| Evidence level | What to record | What the evidence does not establish |
|---|---|---|
| Observed presence | Mentions, supporting citations and recommendations in a defined test sample | How many real buyers saw the answer |
| Platform-reported exposure | Impressions or citation activity within the platform’s stated coverage | Whether the audience noticed, trusted or acted |
| Website behaviour | Identifiable assistant-originated visits, relevant enquiries and conversion events | Every earlier interaction that influenced the buyer |
| Commercial outcomes | Sales acceptance, qualified opportunities, pipeline progression and closed business | That AI discovery caused the entire outcome |
This distinction is becoming part of formal measurement guidance. IAB’s August 2026 framework separates decision-grade measurement from directional signals and emphasises methodology disclosure, stability and reproducibility. IAB
For leadership, the implication is straightforward: a directional presence metric can justify further investigation. It should not automatically justify a revenue claim.
Define qualified sales opportunities with sales before attaching pipeline value to the channel. A relevant visit or enthusiastic enquiry should not become an opportunity merely because the source is interesting.
Build the question set around buyers, not your preferred answers
A useful question set represents the decisions your target customers need to make. It should not be a collection of prompts selected because your company already performs well on them.
Start with buyer intelligence: repeated sales questions, objections, buying triggers and patterns across won and lost opportunities.
Then organise the questions by the job the buyer is trying to complete.
For example, a hypothetical forecasting software company could use the following structure.
| Buyer’s task | Example question | What to evaluate |
|---|---|---|
| Understand a problem | “Why do our sales forecasts change so much near quarter-end?” | Whether useful content is cited accurately |
| Explore a category | “Which forecasting platforms suit a mid-market B2B SaaS company?” | Whether the company enters the consideration set |
| Evaluate practical fit | “Which forecasting tools integrate with Salesforce without a large operations team?” | Whether capabilities and limitations are represented correctly |
| Reduce purchase risk | “What should we check before changing our sales forecasting platform?” | Whether implementation and evaluation content appears |
Keep questions containing your own brand name in a separate group.
“What does Company X do?” tests recognition and accuracy after the company has already been introduced. It does not test whether a buyer would discover Company X independently.
Also separate prompts that explicitly demand a recommendation, a citation or a particular source. Those can be useful diagnostic tests, but they should not quietly replace natural buyer questions.
Keep a stable core and a separate discovery set
Use a fixed core of questions for trend reporting. Add emerging questions to a separate discovery set until you intentionally revise the baseline.
Record the source of each question, its target buyer, buying stage, market and business importance.
Question importance can guide weighting. However, label those weights as business priorities, not audience share. A question your sales team considers important does not automatically represent a known percentage of all AI searches.
How to track AI visibility with a repeatable test
Track AI visibility by repeating a documented set of questions under consistent conditions and retaining the complete results, including failures and unfavourable answers.
Define one observation as a specific question tested on a specific product surface, in a recorded market and language, at a recorded time.
A practical starting pilot could contain 40 questions, two product surfaces and three runs per question during each reporting cycle. That creates 240 planned observations.
The number is an operating example, not a statistical benchmark. It represents 240 tests, not 240 buyers.
Record the conditions behind every observation
Preserve the exact prompt, timestamp, country, language, product surface, available model information, account state and collection method.
Also record whether web search was enabled, whether the conversation contained earlier context, and whether personalisation was active.
These details can affect the test. OpenAI documents that ChatGPT can rewrite questions into search queries and use relevant saved memories or location information when doing so. A familiar account with extensive company context is therefore a poor substitute for an independent discovery test. OpenAI Help Center
For a baseline, use fresh conversations and standardised settings where the product permits them. Mark hidden or unavailable settings as “not disclosed” rather than assuming they are constant.
Keep browser-based observations and API-based tests separately labelled. Ask any measurement provider which experience it actually collects. Do not assume that testing a model through an API reproduces the consumer product your buyers use.
Treat missing data differently from absence
A successfully captured search result without an AI Overview is a valid observation of that search experience. A complete answer without your company is also valid.
A timeout, access block or unusable capture is missing data.
Do not convert missing observations into zero visibility. Equally, do not remove genuine negative results because they lower the score.
Report collection coverage alongside visibility:
Collection coverage = valid observations ÷ planned observations × 100
If coverage changes materially between periods, resolve the collection issue before presenting a clean growth comparison.
Preserve evidence that someone else can inspect
Keep the raw answer, supporting URLs and a screenshot or equivalent capture.
Record whether a link is an explicit supporting citation, a related link or a navigational reference. Do not treat every URL displayed around an answer as equivalent evidence.
Maintain a company and product alias list, too. A matching word is not enough when another business, product or ordinary term uses the same name.
AI search visibility metrics worth reporting
Useful AI search visibility metrics have clear counting rules, visible denominators and a defined business purpose. The formulas below establish a reporting convention for this guide, not a universal industry standard.
For sampled metrics, count presence within the selected AI answer or feature. A valid observation where that feature is absent contributes zero presence, not missing data.
| Metric | Calculation | What it helps answer |
|---|---|---|
| Unprompted brand mention rate | Valid observations mentioning your brand ÷ valid observations in the unbranded question set | Are we appearing without being named first? |
| Owned-domain citation rate | Valid observations citing your website at least once ÷ valid observations | Is our content being used as a supporting source? |
| Recommendation rate | Valid observations recommending your company ÷ valid observations in a predefined recommendation-relevant question set | Are we being presented as an option? |
| Material error rate | Audited brand-containing answers with a verified material error ÷ audited brand-containing answers | Is the answer misrepresenting something important? |
| Topic coverage | Priority topic groups with observed presence ÷ priority topic groups tested | Is visibility broad or concentrated? |
| Collection coverage | Valid observations ÷ planned observations | Is the measurement process functioning consistently? |
Show the underlying counts. “12 of 60 observations” is more informative than “20% visibility” on its own.
For recommendation rate, define the eligible question set before seeing the answers. Otherwise, a team could improve the rate simply by excluding questions where no vendor was recommended.
For error rate, record unresolved claims separately. “Not verified” is not the same as “correct.”
A mention, a citation and a recommendation are different outcomes
When evaluating whether a B2B brand gets recommended by AI, inspect the role assigned to the company.
A reference to your research is not necessarily a supplier recommendation. A neutral directory entry is not an endorsement. An answer explaining why your service is unsuitable is still a mention, but it should not count as a recommendation.
Review factual accuracy separately from tone. A positive answer that invents an integration, certification or service location can be commercially harmful.
Also distinguish citations to your own domain from citations to third-party pages discussing your company. Both can matter, but they indicate different routes to visibility.
Citation share: the denominator can change the story
Citation share measures your portion of a defined pool of citations. The result is only interpretable when the report states what counts as a citation and which sources belong in the pool.
For a simple sampled measure, define one citation unit as one unique cited domain per answer. Five links to the same domain within one answer count as one unit. Retain the individual URLs separately for page-level analysis.
Under that convention:
Sampled citation share = citation units belonging to your domain ÷ citation units across all cited domains × 100
A comparison restricted to your company and selected competitors is a different metric. Label it “citation share within the tracked competitor set.”
Neither metric is market share.
How citation share can double without additional presence
Consider this hypothetical example using an unchanged test panel and counting method.
| Measure | Period one | Period two |
|---|---|---|
| Valid observations | 100 | 100 |
| Observations citing your domain | 20 | 20 |
| Total citation units across all domains | 200 | 100 |
| Your owned-domain citation rate | 20% | 20% |
| Your sampled citation share | 10% | 20% |
Citation share doubled because the total citation pool halved. Your domain still appeared in 20 of 100 observations.
The defensible conclusion is that your relative share increased while your observed citation rate remained unchanged.
That may be useful. It is not evidence that twice as many buyers encountered your content.
Separate feature availability from inclusion
For Google AI Overviews testing, distinguish whether the feature appeared from whether your site appeared inside it.
Suppose 100 valid searches produced 50 AI Overviews, and 10 of those cited your website.
The feature appeared in 50% of searches. Your site appeared in 20% of the displayed AI Overviews and 10% of all valid searches.
Those percentages answer different questions. Reporting only the most flattering one hides part of the result.
Use the platform reporting that now exists
Platform-reported data should complement controlled tests, not be replaced by them. Use native reports for the exposure they actually measure and sampled tests for the answer-level detail they can reveal.
Google Search Console: dedicated AI impressions
Google introduced dedicated generative AI performance reports on June 3, 2026, and states that the insights were rolled out worldwide by August 31, 2026. The Search report covers impressions in AI Overviews and AI Mode. Its documented breakdowns include pages, countries, devices and dates. Google for Developers
The report is not a complete answer-level record or a standalone source of every AI-specific click, query and conversion. Its data is included within the broader Web performance data, so do not add the AI impressions to the overall total as additional exposure. A missing report can also reflect insufficient impressions rather than a confirmed absence from every AI answer. Google Help
Use Search Console to understand observed exposure within Google’s reporting scope. Use your question panel to investigate how selected answers describe and cite the business.
Bing Webmaster Tools: citations and grounding context
Bing’s AI Performance reporting covers citation activity across Microsoft Copilot, AI-generated summaries in Bing and selected partner integrations. Its grounding queries are phrases used to retrieve supporting content, and the displayed grounding-query data represents a sample of citation activity. Do not treat those phrases as a complete record of customers’ original questions. Bing Blogs
In June 2026, Microsoft expanded the preview with Intents, Topics, Citation Share and Compare. Bing’s Citation Share measures your site’s share of citations for a particular grounding query. Microsoft explicitly states that it is not a ranking system, traffic share or a report exposing competitor domains. Bing Blogs
Keep Bing’s native calculation separate from any custom, domain-deduplicated citation share in your own panel.
Google Analytics: assistant-originated traffic
Google Analytics now includes an AI Assistant default channel for traffic from recognised assistant sources. Google’s documentation excludes AI Overviews and AI Mode from that channel; those remain within Organic Search. Google Help
Review the channel alongside session source and medium, landing pages, relevant conversion events and sales outcomes.
Audit older custom channel definitions before comparing historical reports. A classification change should not be presented as audience growth.
Also avoid assuming that every assistant-originated visit came from vendor discovery. The referral identifies a route to the website, not the visitor’s complete research task.
Crawler activity: useful for diagnosis, not audience measurement
Crawler logs can help investigate access, but they are not evidence that a person saw or acted on a recommendation.
OpenAI distinguishes OAI-SearchBot, used for search, from GPTBot, used for content that may support model training, and ChatGPT-User, used for certain user-triggered actions. Counting all three as equivalent “AI visits” would mix different activities. OpenAI Platform
Report bot activity as a technical diagnostic. Keep it outside human traffic, recommendation and pipeline totals.
Connect AI discovery to pipeline without inventing attribution
Connect AI search measurement to commercial outcomes through identifiable evidence, while preserving the difference between a recorded touchpoint and a proven cause.
Use three separate evidence categories.
Observed referral evidence means an identifiable assistant-originated visit was associated with a later enquiry or opportunity under your stated attribution rules.
Buyer-reported evidence means the buyer said an AI answer helped them discover, evaluate or shortlist the company.
Modelled influence means an analytical method estimates a contribution that was not fully observed.
These categories can overlap. Do not add them together as if they represent different customers.
Ask about discovery and evaluation separately
A useful discovery form or sales conversation can ask:
“How did you first hear about us?”
“What helped you decide to contact us?”
The answers can reveal different stages of the journey. A buyer may discover the company through a colleague, check it through an AI assistant and later arrive through branded search.
Record the buyer’s wording before classifying it. Avoid questions that encourage the answer you hope to report.
Apply the same qualification standards to every source
Use the same lead-quality measurement standards for assistant-originated enquiries as for other channels.
Check account fit, relevant need, buyer involvement, sales acceptance and a credible next step.
A new source should not receive easier qualification rules because the marketing team wants an early success story.
Join evidence at the lead, account and opportunity level using appropriate first-party records. Preserve touchpoint dates and deduplicate opportunities before reporting pipeline.
If one opportunity has both referral evidence and a buyer-reported AI touchpoint, it is still one opportunity.
Do not label associated pipeline as incremental revenue
“Pipeline associated with an observed AI referral” is a narrower and more defensible claim than “revenue generated by AI visibility.”
The first describes a recorded relationship. The second implies causation.
Document the attribution window, opportunity stage, value definition and treatment of overlapping channels. Compare acquisition cohorts at similar levels of maturity rather than judging new enquiries against older, fully worked opportunities.
When incremental financial contribution has not been established, report programme costs, qualified outcomes and associated pipeline separately. Do not manufacture a return-on-investment percentage to complete the slide.
Check whether the result changed or the test changed
Before celebrating a visibility increase, confirm that the comparison uses the same question set, counting rules, product surfaces, markets and weighting.
A larger sample can create more raw mentions without improving the mention rate. More branded questions can raise apparent presence. A change in source collection can create more recorded citations.
Report performance on the unchanged question set separately from newly added questions.
Repeated runs help assess consistency for the questions you selected. They do not remove selection bias from a question set that poorly represents buyers.
Likewise, repeating one question many times does not create the same breadth of evidence as testing distinct buying decisions.
For small samples, report counts and observed variation instead of presenting tiny percentage movements as meaningful progress. Formal significance claims should account for repeated observations of the same questions.
Use comparison groups when testing improvements
When updating content, keep a log of the pages changed, the intended improvement and the questions those pages should help answer.
Where practical, compare relevant updated pages or topic groups with similar groups that were not changed during the same period.
That provides a stronger diagnostic than a before-and-after chart alone. It still does not isolate every cause: site-wide changes, competing content and platform changes can affect both groups.
Treat the result as evidence supporting or weakening a hypothesis, not automatic proof that a particular edit caused the outcome.
Turn the report into decisions
A useful visibility report identifies what deserves investigation next. It should not assign a single cause to a metric movement without examining the underlying answers and business data.
| What you observe | What to investigate | Practical next step |
|---|---|---|
| Brand mentions rise, but owned-domain citations remain flat | Whether third-party sources are driving the increase | Inspect cited sources and distinguish brand recognition from website-source presence |
| Citation share rises, but citation rate is unchanged | Whether the denominator or source mix changed | Recalculate on the same question set and counting rules |
| Native impressions rise, but the fixed panel is stable | Whether exposure is growing on questions outside the panel | Review page and topic data before changing the baseline |
| Citations increase, but qualified enquiries do not | Whether the topics, audience and next steps match commercial goals | Review cited pages and enquiry quality before expanding production |
| Recommendation rate rises, but factual errors also increase | Whether the business is being recommended for capabilities it does not have | Correct source information and retest the affected claims |
| Collection coverage falls | Whether the measurement process changed or failed | Repair collection before interpreting visibility trends |
Also examine concentration.
If most owned citations point to one page or one narrow topic, report that dependency. A healthy-looking overall rate can conceal weak coverage across the rest of the buying journey.
Choose tools by inspectability, not dashboard design
Ask measurement providers for raw answers, timestamps, exact prompts, collection methods, supported markets, failure handling and metric definitions.
Check whether historical data remains comparable after the provider changes its methodology. Ask whether exports preserve unsuccessful observations and whether you can audit brand matching and citation classification.
A tool is useful when it reduces collection work without hiding the evidence.
It is less useful when a proprietary score cannot be traced back to the observations that produced it.
A practical 30-day measurement setup
Use the first month to establish reliable measurement and identify testable improvements. Do not make a closed-revenue promise before the sales cycle has had time to mature.
Days 1 to 7: agree on scope. Define target buyers, business questions, product surfaces and markets. Separate unbranded discovery from branded validation. Agree on qualification rules with sales.
Days 8 to 14: establish the baseline. Run the fixed question set, review collection quality and audit a sample of the raw answers. Connect available platform reporting with website analytics and CRM records.
Days 15 to 21: address specific gaps. Investigate inaccurate descriptions, missing supporting evidence, weak purchase-stage coverage and unclear next steps on cited pages. Record each change.
Days 22 to 30: review evidence and decisions. Compare the unchanged test panel, explain denominator changes, inspect qualified outcomes and assign owners to the next actions.
Give ownership of the question set and answer review to marketing or content. Give collection and attribution definitions to analytics or revenue operations. Sales should own acceptance and opportunity qualification.
The first report should make the measurement system more trustworthy, even when the commercial result remains inconclusive.
Frequently asked questions
Can you measure AI search visibility without a paid tracking tool?
Yes. A manual question panel, available platform reports, website analytics and CRM records can support an initial measurement process. The trade-off is operating effort. Use paid tooling when collection, quality control and historical comparison become difficult to maintain manually.
What is a good AI visibility score?
A score is useful only relative to its question set, markets, platforms and counting method. Establish your own baseline and compare against relevant competitors under identical conditions. A high score on easy branded prompts is not necessarily better than a lower score on valuable discovery questions.
How many prompts should a business track?
Track enough distinct questions to cover priority buying decisions and customer segments. Start with a manageable panel, identify coverage gaps and expand deliberately. More prompts are not automatically better when they repeat the same intent or poorly represent your buyers.
How often should AI visibility be measured?
A weekly diagnostic cycle and monthly business review are reasonable starting points. Increase scrutiny around important changes or material inaccuracies, but avoid treating every daily fluctuation as a strategic event. Revisit the question set when the business or buyer priorities change.
Should branded questions be excluded completely?
No. Branded questions are useful for checking recognition, accuracy, comparisons and purchase-stage information. Report them separately from unbranded discovery so that being named in the prompt does not inflate the apparent ability to attract new buyers.
Can tracked answers be used to calculate click-through rate?
Not by combining sampled answers with actual website visits. The sampled answers are tests, not measured user impressions. Click-through rate requires compatible click and impression data from the same population, reporting scope and period.
How long should a company wait before judging commercial impact?
Use the company’s actual sales cycle and the maturity of the enquiry cohort. Evaluate collection quality, answer accuracy and relevant presence first. Judge opportunity progression and closed business only after those prospects have had a reasonable chance to move through sales.
Measure AI search visibility as evidence, not as revenue
The practical decision is to build a measurement system before committing to a visibility target.
Use buyer-led questions. Preserve the raw answers. Separate mentions, citations and recommendations. Read platform metrics according to their actual definitions. Connect identifiable behaviour to qualified outcomes without claiming more than the evidence supports.
A useful report should make the next decision clearer, not merely make the previous investment look better.
For a second opinion from Growleads, start with your question set, raw answer samples and qualification criteria. Those inputs provide a stronger basis for deciding where to invest than a screenshot of one favourable answer.

Builds the demand intelligence, automation, and deliverability systems behind Growleads pipeline.