
Marketing-Sourced Revenue: A Better Metric for B2B Boards
The VP Marketing of an $80M ARR SaaS company told her board last quarter that marketing had sourced 42 percent of new revenue. The board nodded. Three weeks later her CFO asked, in a one-on-one, whether the number was real. We were brought in to rebuild the attribution model.
Six weeks of work. The honest number was 27 percent sourced, 38 percent influenced, and 35 percent that we could not cleanly assign either way. The VP Marketing was nervous about the conversation. The board’s response was relief, not punishment. The honesty bought her more trust than the inflated number ever had.
Most marketing-sourced revenue numbers in B2B are wrong by 10 to 20 points in either direction. The math is messy by design. Multi-touch attribution models are built on assumptions about journeys nobody can verify. The platforms that publish them have a commercial interest in inflating the marketing column. And the underlying question, “did marketing or sales source this deal,” is a credit war, not a learning instrument.
This piece is for the VP Marketing who wants to stop running the credit war and start running an attribution model that produces decisions, not arguments. The shift is to signal-level attribution, and the math is below.
What marketing-sourced revenue actually measures, and what it does not
Marketing-sourced revenue is the share of closed-won revenue where a marketing-owned touch came first in the buyer’s recorded journey. The standard reporting flavors are first-touch, last-touch, and multi-touch (linear, U-shaped, time-decay). Every flavor produces a different number. None of them produces a true number.
What the metric actually measures is a credit assignment under a chosen attribution model. The model is a choice. Most B2B teams pick the model that flatters their organizational politics. Marketing teams favor first-touch and U-shaped (which give marketing more credit). Sales teams favor last-touch (which gives sales more credit). The choice is consequential and rarely examined.
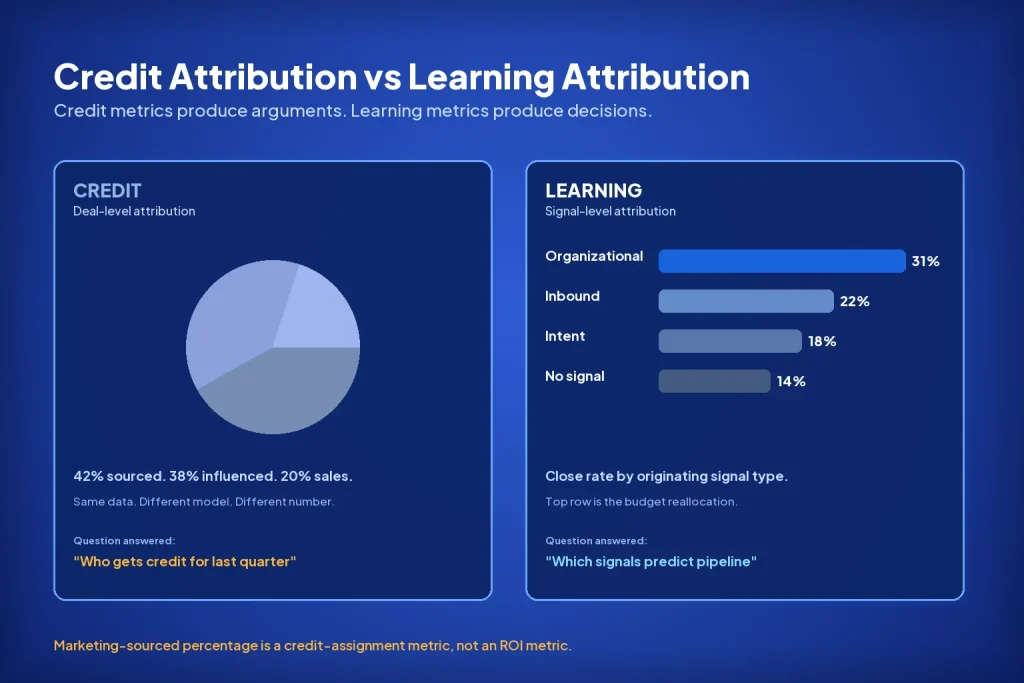
What the metric does not measure is which marketing investment produced revenue. A 42 percent marketing-sourced number might come from one campaign that drove 35 percent or from forty campaigns each contributing one percent. The number tells the board nothing about which inputs to scale or kill. It only tells them that marketing was somewhere in the mix.
The deeper issue is that “sourced” is a present-tense classification of a past event. Boards do not need to know how to assign credit for last quarter’s revenue. They need to know which inputs to fund this quarter to produce next quarter’s revenue. Sourced-percentage attribution does not answer that question.
The two questions worth asking instead
Replace the credit-war metric with two questions that actually inform the next decision.
Question one: which marketing-surfaced signals correlated with closed-won revenue?
This is signal-level attribution. Not “marketing sourced this deal” but “marketing surfaced this account, on this date, via this signal type, and the deal closed at this rate.” It changes the unit of analysis from deals (where credit is contested) to signals (where the data is cleaner).
The Series B fintech we worked with in Q1 2026 ran this analysis on the previous four quarters of closed deals. Marketing-surfaced organizational signals (new VP hires, funding events, stack changes) closed at 31 percent. Marketing-surfaced intent signals (topic surges, third-party content engagement) closed at 18 percent. Sales-prospected accounts with no marketing-surfaced signal closed at 14 percent. Same sales team, same product. The signals were the variable.
That data drove a budget decision marketing-sourced percentage could never produce: shift 40 percent of the intent-data budget into organizational-signal infrastructure for Q2. The shift produced a 3.2x reply-rate gain on the affected segment, consistent with our broader buying signal database findings across 18 fintech campaigns.
Question two: what is marketing’s win-rate lift over the baseline?
The baseline is the win rate of deals with no marketing-surfaced signal. The marketing-influenced win rate is the lift over that baseline.
For the same fintech, baseline win rate was 14 percent. Marketing-influenced win rate (any marketing signal in the journey) was 26 percent. Marketing’s lift was 12 absolute points, or roughly 86 percent relative.
That number is what the board actually wants. It is a counterfactual: if you turned marketing off, this is the revenue you would lose. It is also defensible across attribution models because it does not depend on credit assignment within a deal. It only depends on whether marketing was anywhere in the journey or not.
These two questions reframe the conversation. The first question makes marketing budget decisions tractable. The second question makes the board conversation tractable. Marketing-sourced percentage does neither.
Signal-level attribution: the math
Signal-level attribution works in three steps. None of them require a new platform.
Step one: classify every closed-won deal by the buying signals that surfaced the account.
Pull the last 100 to 200 closed-won deals. For each, identify the earliest detectable signal: was it an organizational change (executive hire, funding, stack shift), an intent signal (topic surge, content engagement, search behavior), an inbound signal (form fill, demo request), or no detectable signal (sales-prospected cold)?
This is the data hygiene step. If your CRM does not record the originating signal for more than half of closed deals, that is the work to do first. Without it, the rest of the analysis runs on guesses.
Step two: calculate close rate per signal type.
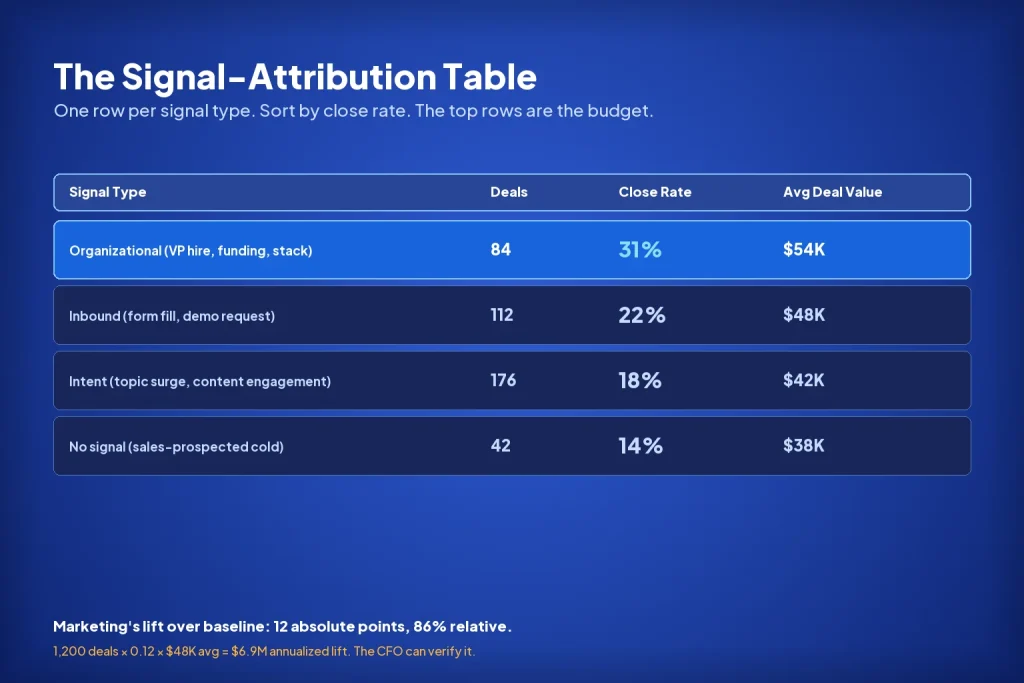
For the fintech example: organizational signals closed at 31 percent, intent signals at 18 percent, inbound at 22 percent, sales-prospected (no signal) at 14 percent. Note these are close rates from qualified opportunity, not contact-to-close. The unit needs to be consistent across signal types.
The output is a table with one row per signal type and three columns: count of deals, close rate, average deal value. Sort by close rate. The top rows are the signals worth scaling.
Step three: calculate marketing’s lift over baseline.
Baseline = close rate for deals with no marketing-surfaced signal. Marketing-influenced = close rate for deals with any marketing-surfaced signal. The difference is marketing’s contribution at the deal level. Multiply by deal volume and you have the dollar value of marketing’s lift.
For the fintech: baseline 14 percent close rate. Marketing-influenced 26 percent. 12 points of lift on roughly 1,200 qualified opportunities per year at $48K average deal value. Marketing’s annualized lift: 1,200 × 0.12 × $48,000 = $6.9M.
That is a number the board can act on. It is also a number the CFO can verify, because it is a counterfactual computed at the deal level, not a credit assignment imposed by an attribution model.
The board conversation that actually changes things
The traditional marketing-sourced board slide is a pie chart with three slices: marketing-sourced, marketing-influenced, sales-sourced. It produces approving nods and zero decisions.
The signal-level board slide is a different format. Three rows of data:
1. Marketing’s win-rate lift over baseline, in absolute points and dollar terms (e.g., 12 points, $6.9M annualized). 2. Top three signals by close rate, with the count of deals each produced last quarter. 3. The single largest budget reallocation marketing is recommending for next quarter, based on the signal data.
The third row is what changes the conversation. It is marketing taking a position on its own infrastructure, not asking the board for credit. It is also the row most marketing teams skip, which is why most marketing-sourced presentations produce nods instead of decisions.
The $80M SaaS VP Marketing I mentioned in the opening rebuilt her board narrative around exactly this format the following quarter. The board started asking which signals were producing closed-won revenue, not whether the marketing-sourced number had moved. The credit war was over. The strategy conversation had started.
This is the operational pattern under revenue intelligence and the attribution layer of the revenue architecture for B2B frame: Layer 5 (attribution) is not about credit, it is about feedback into Layers 1 and 2 (signal and scoring). The board conversation moves with it.
Common attribution traps
Four patterns we have seen across 200+ B2B campaigns since 2023.
Trap one: the multi-touch model that explains nothing. A team adopts U-shaped or time-decay attribution because the platform defaults to it. Six months later, the model produces a marketing-sourced number that fluctuates 8 percent quarter-over-quarter for reasons nobody can explain. The model is unfalsifiable. It cannot be wrong because there is no test it could fail. That is also why it cannot inform a decision.
Trap two: the dashboard that lags the budget cycle. Attribution data takes 90 days to mature for typical B2B cycles. Marketing budgets get set on monthly or quarterly cadence. The dashboard always reports on a budget that is two quarters old. The team optimizes for last quarter’s data and the budget keeps moving without learning. The fix is to attribute at the signal level (which can be measured in days, not quarters) rather than at the deal level alone.
Trap three: the pipeline-influence inflation game. “Marketing-influenced” is defined so broadly that almost every closed deal has at least one marketing touch in it. The number drifts toward 80 to 90 percent and stops being useful. The fix is to define influence with a quality threshold: a deal is marketing-influenced only if a marketing-surfaced signal preceded the first sales touch by at least seven days. The threshold cuts the number in half and restores its usefulness.
Trap four: optimizing for the metric instead of the decision. Once “marketing-sourced percent” becomes a board KPI, the team starts optimizing for it. Campaigns get prioritized that drive first-touch, even if they produce poor close rates downstream. The metric improves; the revenue does not. This is the most damaging trap because it is invisible until two or three quarters in. The honest version: we ran exactly this trap internally for one quarter in 2024 before recognizing it.
What to test this quarter
If you are a VP Marketing reading this with a marketing-sourced number on your board sheet, here is a one-week test.
Pull the last 100 closed-won deals. Bucket them by originating signal: organizational, intent, inbound, no signal. Calculate close rate per bucket. Compare the close rate of any-marketing-signal deals against no-signal deals. The difference is marketing’s lift, in absolute points.
If your data is too messy to run this, the data hygiene work is the first move. Investing in attribution platforms before fixing the underlying CRM signal capture is the most expensive form of attribution error. The platforms cannot fix what the CRM never recorded.
If the data is clean and the lift is real, the board conversation changes. The number is defensible, the levers are visible, and the decision-making moves from credit assignment to budget allocation. That is the entire point of marketing-sourced revenue as a metric, and the credit-war framing has been getting in the way of it.
If you want to see what signal-level attribution looks like for your specific revenue mix, our demand intelligence service starts every engagement with a signal-attribution audit. The output is the table above, populated with your actual data, plus the budget-reallocation recommendation for the next quarter. Talk to us about that.
Frequently asked questions
What is marketing-sourced revenue?
Marketing-sourced revenue is the share of closed-won revenue where a marketing-owned touch came first in the buyer’s journey, under a chosen attribution model. Different models (first-touch, last-touch, multi-touch) produce different numbers from the same data. The metric measures credit assignment, not marketing’s actual contribution to revenue.
What is a good marketing-sourced revenue percentage?
There is no universal good percentage because the number depends on the attribution model, the company’s go-to-market motion, and how broadly “sourced” is defined. Numbers between 20 and 60 percent are common in B2B SaaS at $50M to $500M ARR. The more useful question is marketing’s win-rate lift over the no-signal baseline, which is comparable across models.
What is the difference between marketing-sourced and marketing-influenced revenue?
Marketing-sourced means a marketing touch was first in the journey. Marketing-influenced means a marketing touch appeared anywhere in the journey, regardless of position. Influenced numbers tend to inflate over time as definitions broaden. A useful threshold for influence is requiring a marketing-surfaced signal at least seven days before the first sales touch.
How do you calculate marketing-sourced revenue?
The textbook calculation: total closed-won revenue from deals where a marketing touch was first, divided by total closed-won revenue. The number depends on the attribution model. A more useful calculation is signal-level attribution: classify each closed deal by its originating signal type, calculate close rate per signal, and report marketing’s win-rate lift over the no-signal baseline.
Is marketing-sourced revenue the same as marketing ROI?
No. Marketing-sourced revenue is a credit-assignment metric. Marketing ROI is the return on marketing investment, calculated as (revenue lift attributable to marketing minus marketing cost) divided by marketing cost. The two are related but not the same. ROI requires a counterfactual (what would revenue be without marketing); sourced-percentage does not.
How accurate is marketing-sourced revenue as a metric?
Most marketing-sourced numbers in B2B are wrong by 10 to 20 points in either direction. The error comes from incomplete journey data, attribution-model assumptions, and definition drift over time. The metric is more reliable as a directional indicator across quarters than as a precise number in any single quarter.
Why is signal-level attribution better than deal-level attribution?
Signal-level attribution measures things that can be observed without assumptions: which signal surfaced an account, when, and what the close rate was. Deal-level attribution requires assigning credit across multiple touches in a journey, which always involves an attribution model and the assumptions that come with it. Signal-level attribution produces decisions; deal-level attribution produces arguments.
About the author: Malay Gupta is Partner and Head of Operations and Growth at Growleads, a demand intelligence agency for B2B revenue teams at $50M to $500M ARR. He has run more than 200 B2B campaigns since 2023 and works directly with VP Marketing leaders on signal-level attribution. Connect on LinkedIn.

Builds the demand intelligence, automation, and deliverability systems behind Growleads pipeline.